Cardiac Axis Interpretation, Animation.
Автор: Alila Medical Media
Загружено: 2020-10-05
Просмотров: 375116
Описание:
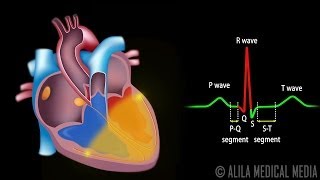
(USMLE topics, cardiology) What is the heart axis? How to calculate cardiac axis on an ECG strip? Methods for estimation/determination of cardiac axis.
Purchase a license to download a non-watermarked version of this video on AlilaMedicalMedia(dot)com
Check out our new Alila Academy - AlilaAcademy(dot)com - complete video courses with quizzes, PDFs, and downloadable images.
©Alila Medical Media. All rights reserved.
All images/videos by Alila Medical Media are for information purposes ONLY and are NOT intended to replace professional medical advice, diagnosis or treatment. Always seek the advice of a qualified healthcare provider with any questions you may have regarding a medical condition.
Cardiac axis is the net direction of electrical activity during depolarization. In a healthy heart, the net movement is downward and slightly left. This axis is altered, or deviated, in certain conditions. For example, in left ventricular hypertrophy the axis is skewed further left; while right ventricular hypertrophy results in a deviation to the right. Cardiac axis can be determined by examining the 6 limb leads, which look at the heart from different angles in a vertical plane. The QRS axis is the most important, and also the easiest to be determined, as it represents ventricular depolarization. The QRS axis is considered normal when it is between -30 and +90 degrees. Left axis deviation is between -30 and -90 degrees. Right axis deviation goes between +90 and +180 degrees. The rest is known as northwest axis or extreme axis deviation. Remember that depolarization TOWARD a lead produces a POSITIVE deflection; depolarization AWAY from a lead gives a NEGATIVE deflection. Impulses moving at a 90 degree angle relative to a lead produce an isoelectric, or equiphasic result with positive and negative deflections of similar amplitude. There are several methods to estimate the QRS axis; we here discuss 2 of them. The quadrant method. This method looks at the QRS complex in lead 1 and lead aVF. If the QRS complex is mostly positive in both leads, the axis is somewhere in between the 2 leads, which is in the normal range. If it’s negative in lead I and positive in aVF, the axis is running away from lead I but toward aVF and is thus in the lower right quadrant. The diagnosis is right axis deviation. A positive value in lead I and negative in lead aVF, place the axis in the upper left quadrant, which interprets as possible left axis deviation. A more accurate method will be needed to further determine if it is borderline normal or left deviation. Negative values of the QRS complex in both leads are indicative of extreme axis deviation. The isoelectric lead method: this method consists of finding the isoelectric or equiphasic lead – the one with equal, or closest to equal, negative and positive deflections. In other words, the one with zero, or nearest to zero, net amplitude. The axis line is perpendicular to the direction of the isoelectric lead. Next, look at the lead that runs nearest to this line. If the QRS complex is positive in that lead, the axis points to roughly the same direction as the lead. If it is negative, the axis points to the opposite direction.
Повторяем попытку...

Доступные форматы для скачивания:
Скачать видео
-
Информация по загрузке: