Plant Growth Analysis in R | 3D Surface Plot for Interaction Effects
Автор: Jan'z Biology Education
Загружено: 2026-02-11
Просмотров: 61
Описание:
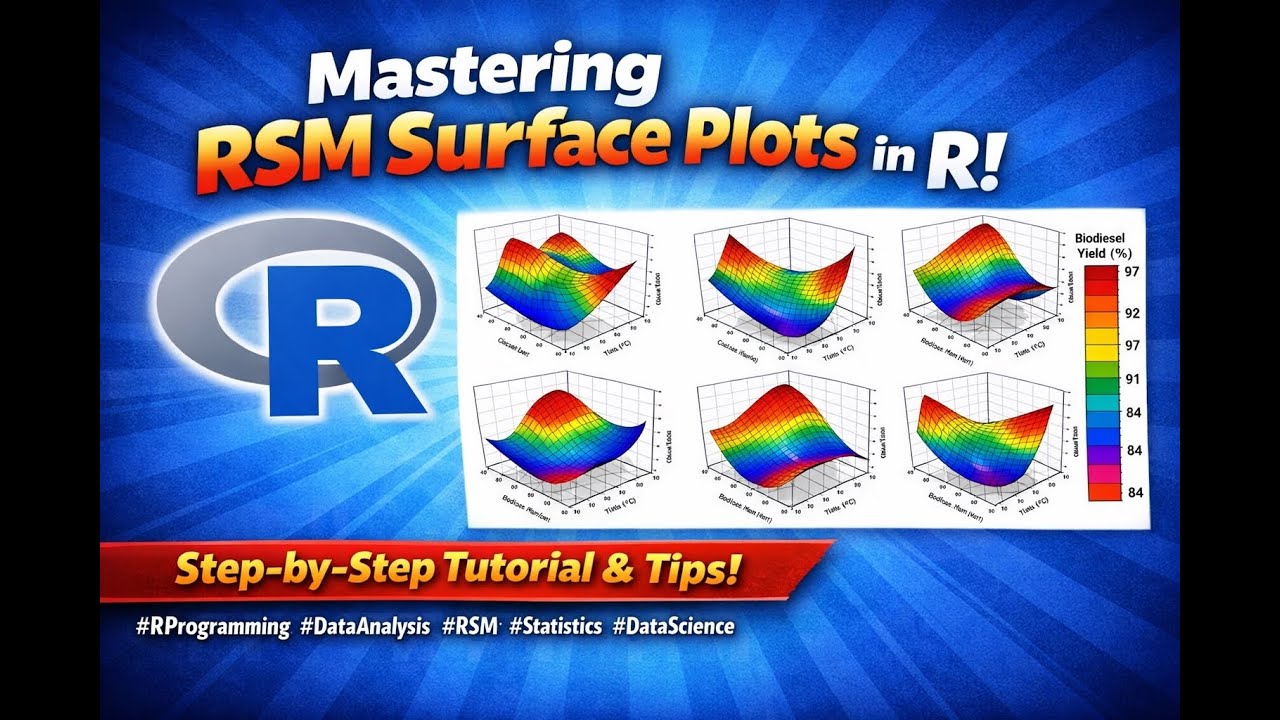
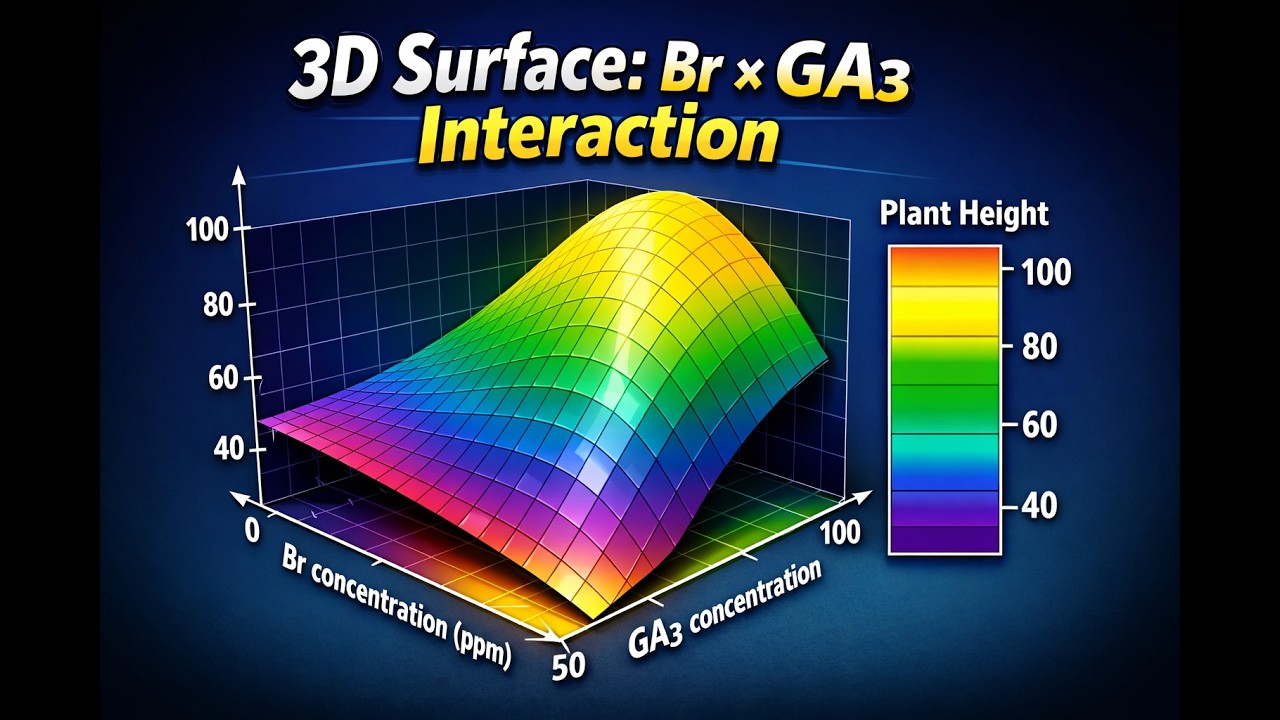
In this tutorial, we demonstrate how to create a professional 3D surface plot in R using a Response Surface Model (RSM). The example shows the interaction between Br concentration and GA₃ concentration and their combined effect on plant height.
You will learn:
• How to build a linear interaction model in R
• How to generate a prediction grid
• How to convert predicted values into a surface matrix
• How to apply a scientific color gradient
• How to design a thumbnail-style 3D surface plot
• How to export high-resolution TIFF images for publication or presentations
This tutorial is ideal for researchers, PhD scholars, agricultural scientists, plant physiologists, and students working in experimental design, RSM, and statistical modeling.
The script uses base R functions and produces publication-quality output suitable for research papers, theses, and conference presentations.
If you work on plant growth regulators, factorial experiments, or interaction analysis, this video will help you visualize your results effectively.
Keywords Covered
Response Surface Methodology (RSM)
3D Surface Plot in R
Brassinosteroid (Br)
Gibberellic Acid (GA₃)
Plant Height Modeling
Statistical Visualization
Experimental Design in R
Повторяем попытку...

Доступные форматы для скачивания:
Скачать видео
-
Информация по загрузке: