ycliper

Популярное

Музыка Кино и Анимация Автомобили Животные Спорт Путешествия Игры Юмор

Интересные видео

2025 Сериалы Трейлеры Новости Как сделать Видеоуроки Diy своими руками

Топ запросов

смотреть а4 schoolboy runaway турецкий сериал смотреть мультфильмы эдисон
Скачать

GC–MS Chromatogram Visualization Using R | ggplot2 & dplyr Tutorial

Автор: Jan'z Biology Education

Загружено: 2026-02-14

Просмотров: 53

Описание: 
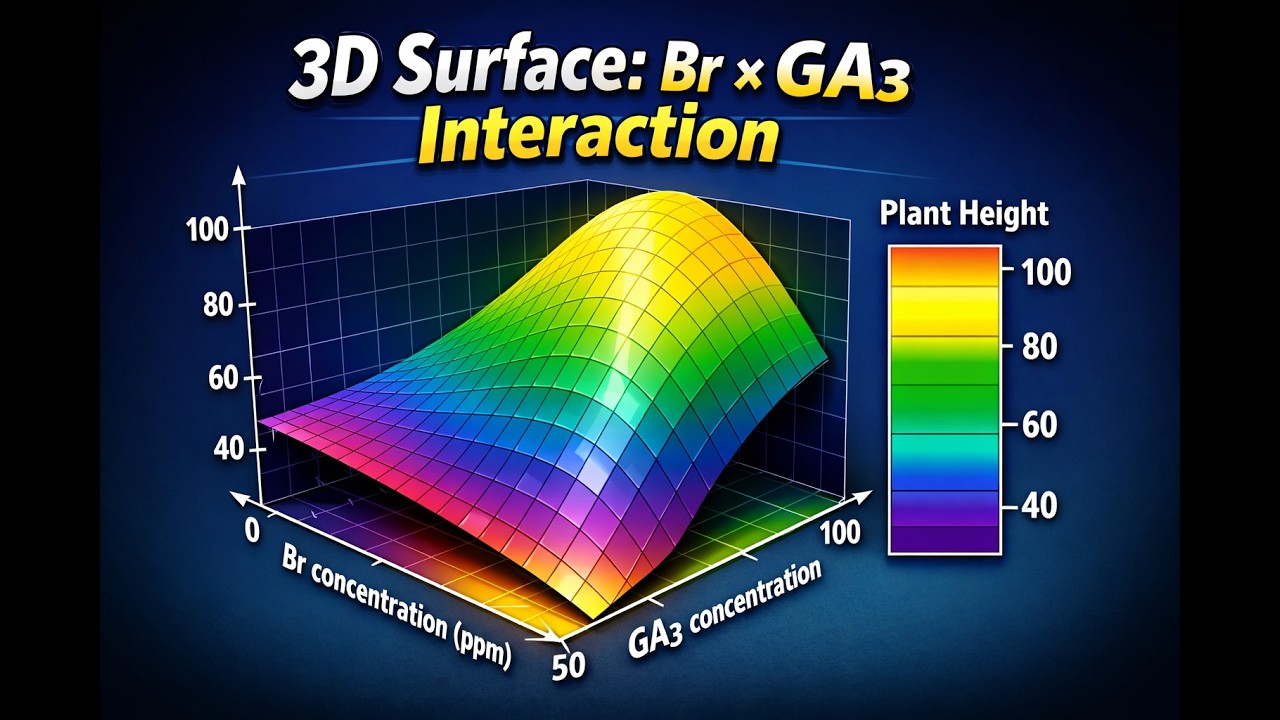
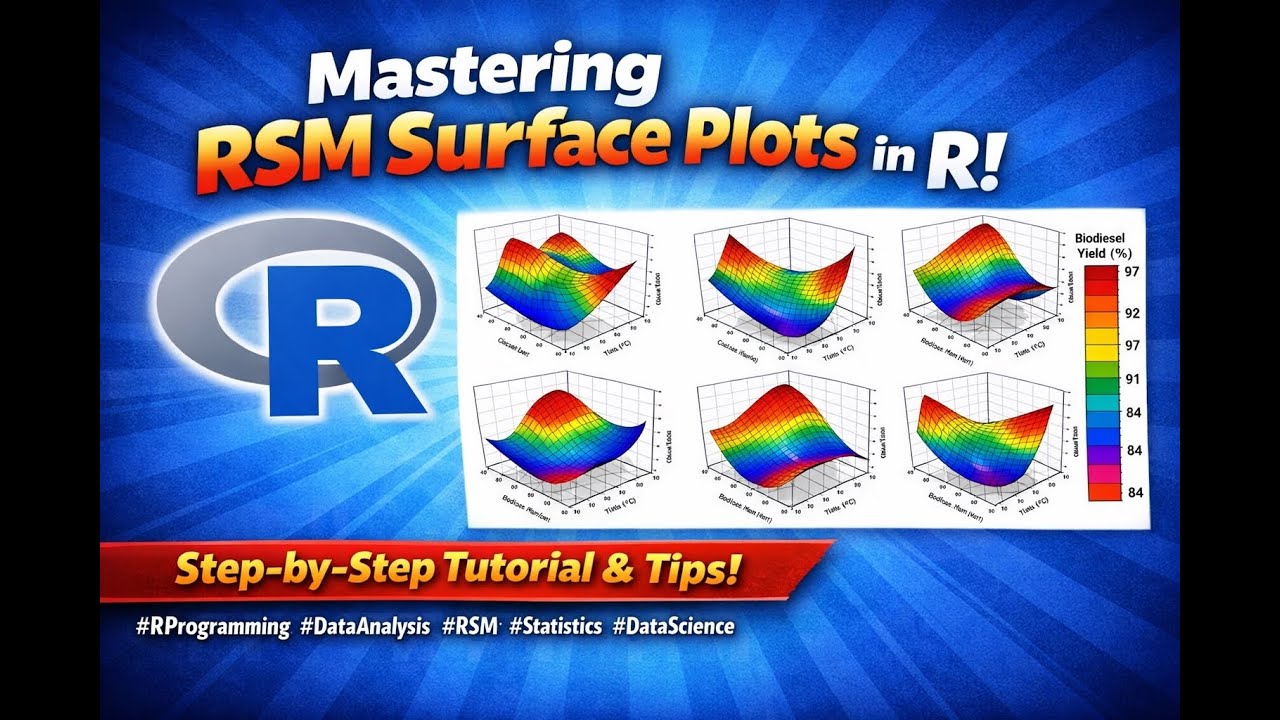
Learn how to generate high-resolution GC–MS chromatograms using R! This tutorial demonstrates how to visualize chemical profiles with ultra-narrow peaks, annotate peak numbers, and emphasize specific peaks for clarity.

What’s included in this video:
GC–MS chromatogram generation in R using ggplot2 and dplyr
Simulation of ultra-narrow Gaussian peaks for better visualization
Customizable peak annotations with arrows
Tips for highlighting key peaks for clarity
Exporting high-resolution chromatograms and peak tables
Applications: Analytical chemistry, phytochemistry, natural product research, and teaching GC–MS data visualization.

Не удается загрузить Youtube-плеер. Проверьте блокировку Youtube в вашей сети.
Повторяем попытку...
GC–MS Chromatogram Visualization Using R | ggplot2 & dplyr Tutorial

Поделиться в:

Доступные форматы для скачивания:

Скачать видео

  • Информация по загрузке:

Скачать аудио

Похожие видео

Box Plot in R Using ggplot2 | Statistical Visualization with Tukey Letters | Complete Tutorial

Box Plot in R Using ggplot2 | Statistical Visualization with Tukey Letters | Complete Tutorial

R Programming Tutorial: 3D Response Surface Plot with Color Legend

R Programming Tutorial: 3D Response Surface Plot with Color Legend

Яндекс Плюс: как ПОДСАДИЛИ 45 млн человек на подписку, от которой нельзя уйти?

Яндекс Плюс: как ПОДСАДИЛИ 45 млн человек на подписку, от которой нельзя уйти?

Дефолт Автономии Долиной

Дефолт Автономии Долиной

DSA Bootcamp | Session - 02 | Prefix Sum, Hash Map

DSA Bootcamp | Session - 02 | Prefix Sum, Hash Map

Przedwojenna Kronika lat 30 – Odcinek I

Przedwojenna Kronika lat 30 – Odcinek I

AI News: 5 New Models Dropped This Week!

AI News: 5 New Models Dropped This Week!

Meissner & Walkowski - Kreml obawia się polskich zbrojeń i to widać!

Meissner & Walkowski - Kreml obawia się polskich zbrojeń i to widać!

3835. Count Subarrays With Cost Less Than or Equal to K

3835. Count Subarrays With Cost Less Than or Equal to K

R 3D Surface Plots Tutorial | Master Colorful 3D RSM Plots in R

R 3D Surface Plots Tutorial | Master Colorful 3D RSM Plots in R

Google выпустила предварительную версию Gemini 3.1 Pro, и это просто невероятно! (Новые варианты ...

Google выпустила предварительную версию Gemini 3.1 Pro, и это просто невероятно! (Новые варианты ...

Longest Almost-Palindromic Substring

Longest Almost-Palindromic Substring

Financial Modelling with AI Explained for Beginners | New Batch Launch & Career Scope

Financial Modelling with AI Explained for Beginners | New Batch Launch & Career Scope

ZIEMKIEWICZ: Żurek chciał zabetonować KRS! Prezydent uratował sądy przed chaosem?

ZIEMKIEWICZ: Żurek chciał zabetonować KRS! Prezydent uratował sądy przed chaosem?

Anthropic just BANNED OpenClaw...

Anthropic just BANNED OpenClaw...

AI Race: OpenAI vs Anthropic

AI Race: OpenAI vs Anthropic

33   Unveiling GPT 2 Explore Text Generation Basics!

33 Unveiling GPT 2 Explore Text Generation Basics!

Plant Growth Analysis in R | 3D Surface Plot for Interaction Effects

Plant Growth Analysis in R | 3D Surface Plot for Interaction Effects

3D Surface Plot in R with Color Legend | Br × GA3 Plant Height Interaction Tutorial

3D Surface Plot in R with Color Legend | Br × GA3 Plant Height Interaction Tutorial

3020. Find the Maximum Number of Elements in Subset

3020. Find the Maximum Number of Elements in Subset

© 2025 ycliper. Все права защищены.


  • Контакты
  • О нас
  • Политика конфиденциальности


Контакты для правообладателей: [email protected]