Скачать
Creating and analysing a simple bar graph in SigmaPlot 13
Автор: Dory Video
Загружено: 2016-08-22
Просмотров: 88713
Описание:
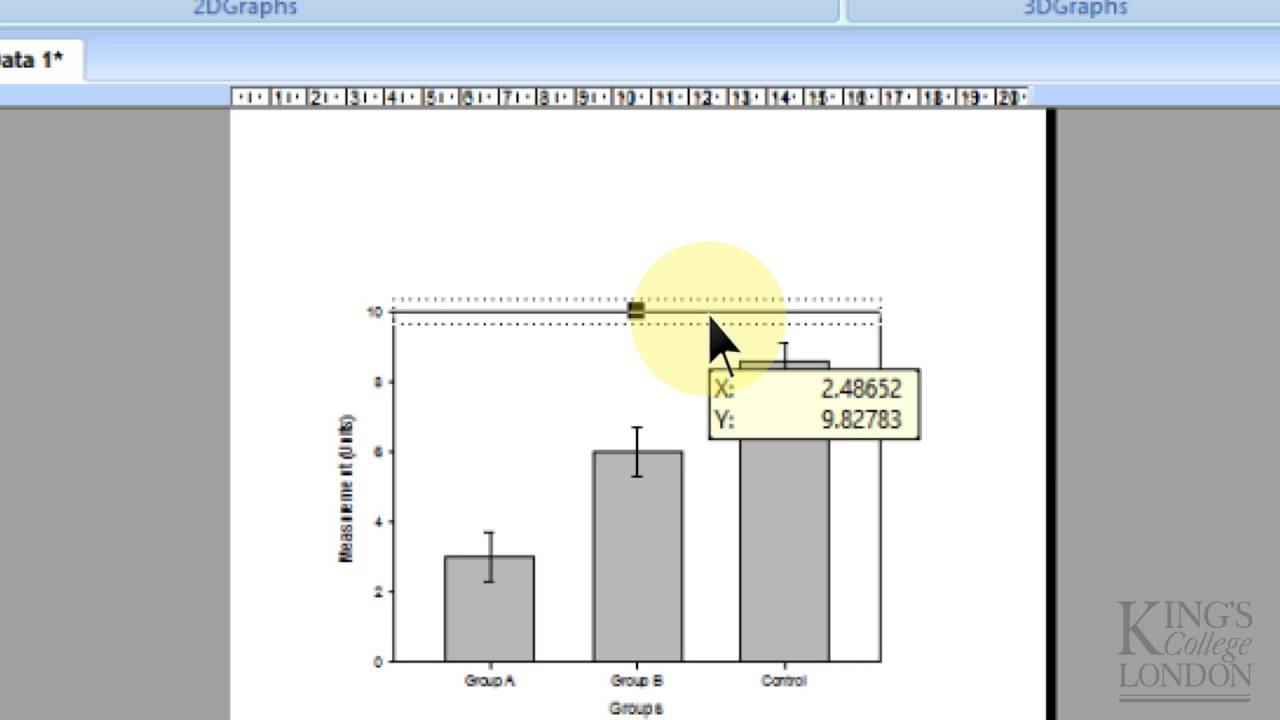
This tutorial runs through the process of creating a simple bar graph comparing three sets of raw data using SigmaPlot. Once the graph is made a one-way ANOVA with multiple comparisons test is carried out to compare the data sets.
©2016 James Clark, KCL
Не удается загрузить Youtube-плеер. Проверьте блокировку Youtube в вашей сети.
Повторяем попытку...
Повторяем попытку...
Доступные форматы для скачивания:
Скачать видео
-
Информация по загрузке: