Скачать
Gráfico de barras com dois eixos no SigmaPlot (Bar graphs with 2 (two) axes using SigmaPlot)
Автор: Simplificando
Загружено: 2023-04-06
Просмотров: 2419
Описание:
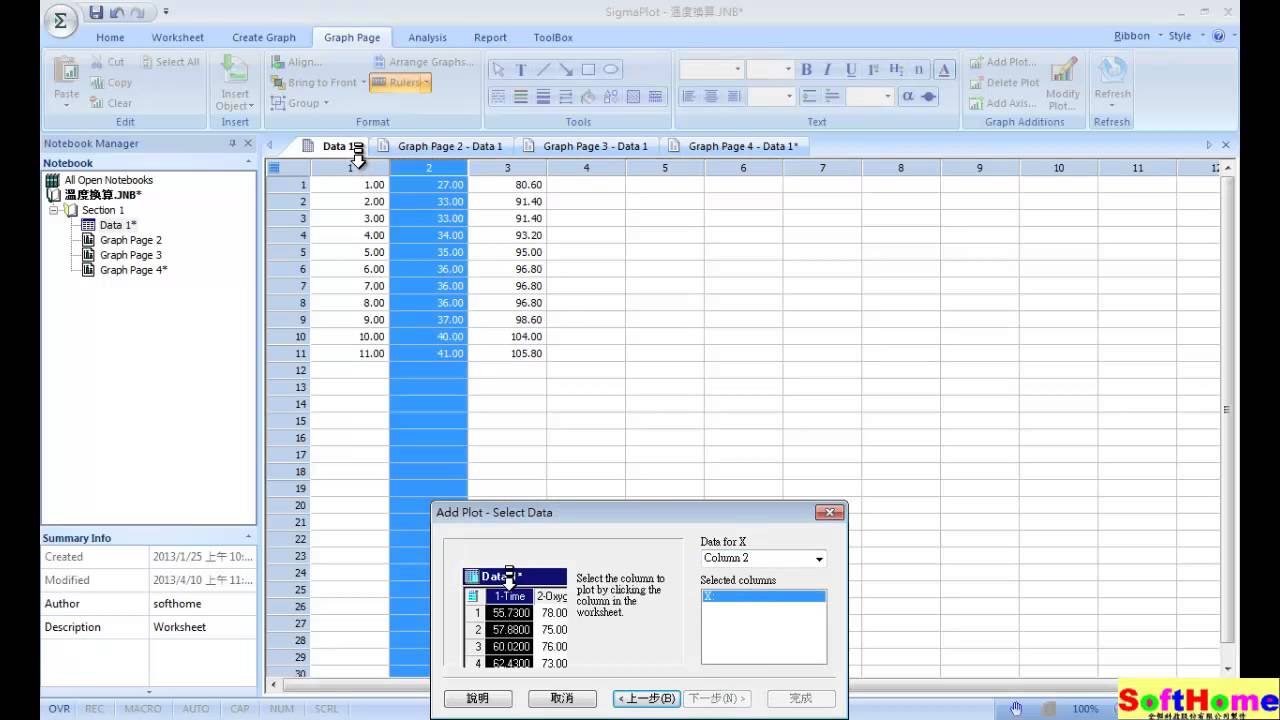
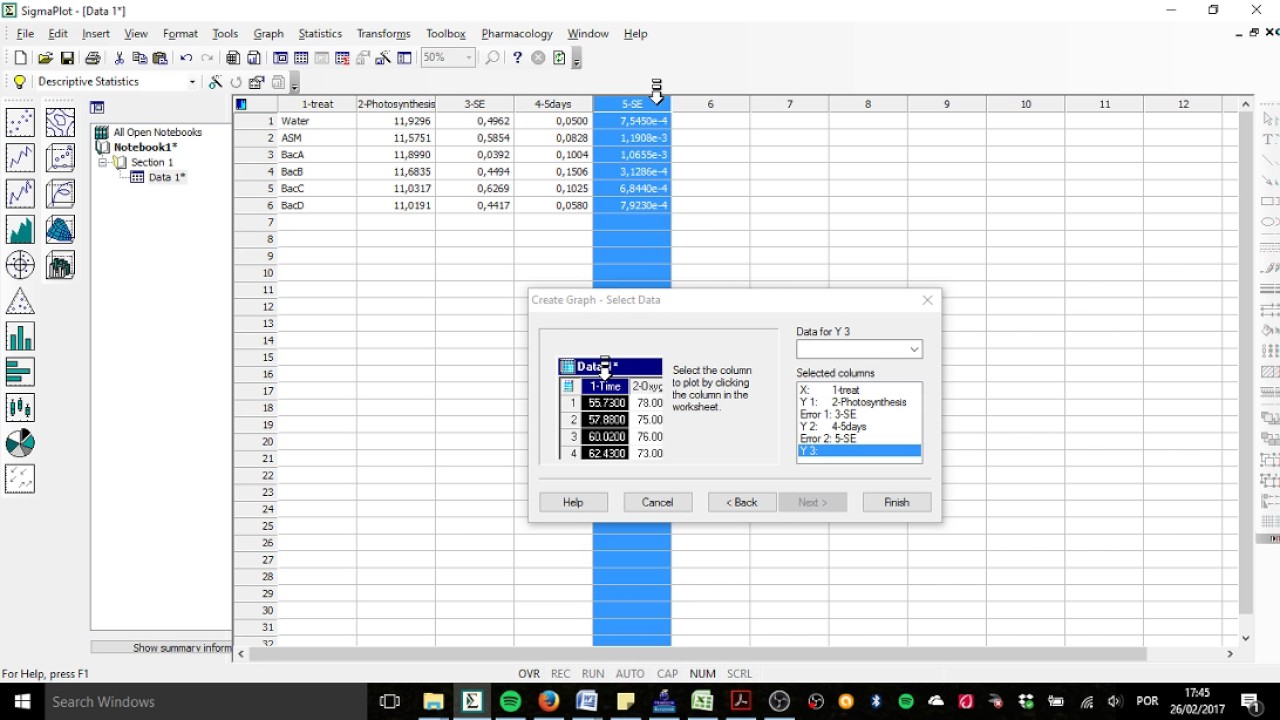
Nesse vídeo veremos como fazer um gráfico de barras com dois eixos Y usando o SIgmaPlot. De forma que as duas variáveis sejam representadas em Y por barras para cada valor de X, sem que as mesmas fiquem sobrepostas.
In this video we will see how to make a bar graph with two Y axes using SigmaPlot. So that the two variables are represented in Y by bars for each value of X, without overlapping them.
Не удается загрузить Youtube-плеер. Проверьте блокировку Youtube в вашей сети.
Повторяем попытку...
Повторяем попытку...

Доступные форматы для скачивания:
Скачать видео
-
Информация по загрузке:


![Эффект Джанибекова [Veritasium]](https://imager.clipsaver.ru/N9HlQ-XVnFk/max.jpg)