Скачать
Choose the right chart - Composition
Автор: Qlik Help
Загружено: 2015-11-25
Просмотров: 17417
Описание:
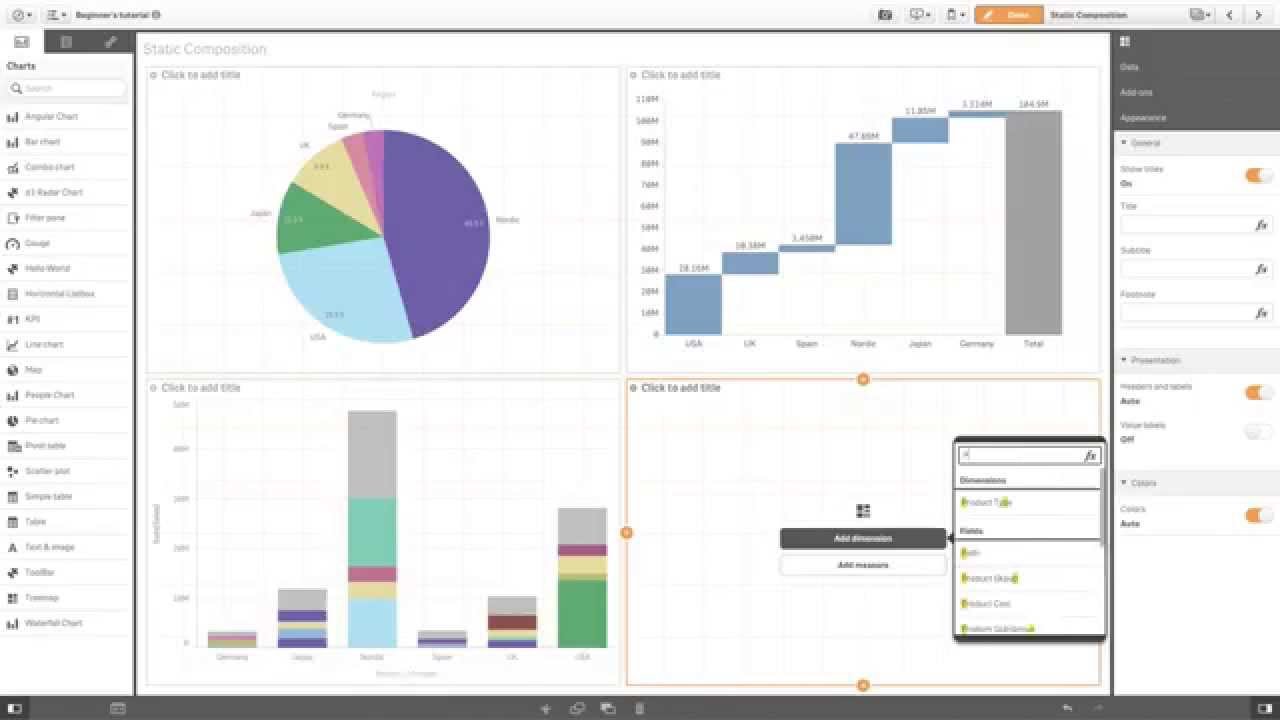
Composition charts are used to see how a part compares with the whole, and how a total value can itself be divided up.
A composition chart shows the relative value, but some charts can also be used to show the absolute difference.
To learn more about Qlik Sense visit the help site - http://help.qlik.com/sense
Не удается загрузить Youtube-плеер. Проверьте блокировку Youtube в вашей сети.
Повторяем попытку...
Повторяем попытку...
Доступные форматы для скачивания:
Скачать видео
-
Информация по загрузке:


