Скачать
Choose the right chart - Relationship
Автор: Qlik Help
Загружено: 2015-11-25
Просмотров: 6053
Описание:
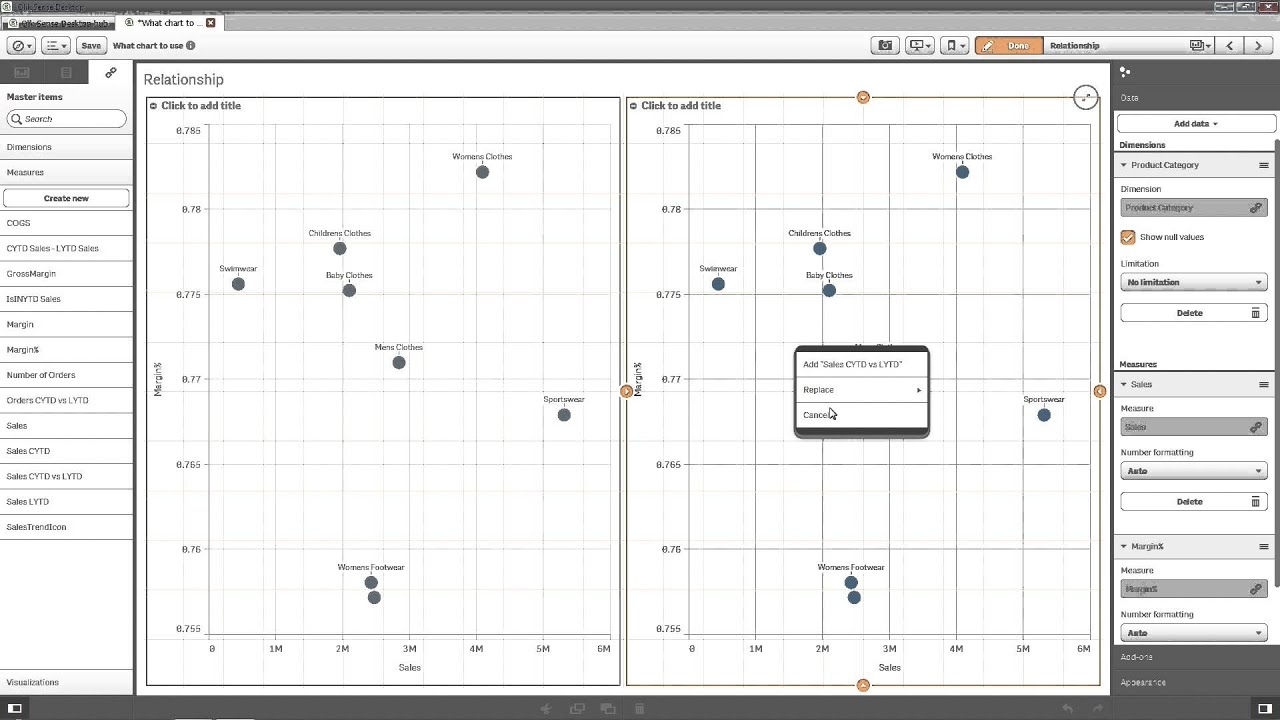
If you want to emphasize the relationship between data, you can use a relationship chart. This can be used to find correlations, outliers and clusters of data.
Relationship charts answer questions such as: “is there a correlation between advertising spend and sales for our products?
Or, how do expenses and income vary per region and what’s the deviation?
To learn more about Qlik Sense visit the help site - http://help.qlik.com/sense
Не удается загрузить Youtube-плеер. Проверьте блокировку Youtube в вашей сети.
Повторяем попытку...
Повторяем попытку...
Доступные форматы для скачивания:
Скачать видео
-
Информация по загрузке:


