CellProfiler: Constructing pipelines
Автор: Broad Institute
Загружено: 2012-08-06
Просмотров: 14673
Описание:
Copyright Broad Institute, 2013. All rights reserved.
This introductory tutorial to constructing pipelines in CellProfiler demonstrates some of the basics of using CellProfiler, such as starting the software, opening images and changing the input and output folders. You will also learn how to create, load and save pipelines, plus pointers for additional help.
For more information about the Broad's Imaging Platform and other software tools available, please visit:
-Imaging Platform (https://www.broadinstitute.org/node/144)
-Software (https://www.broadinstitute.org/scient...)
Transcript:
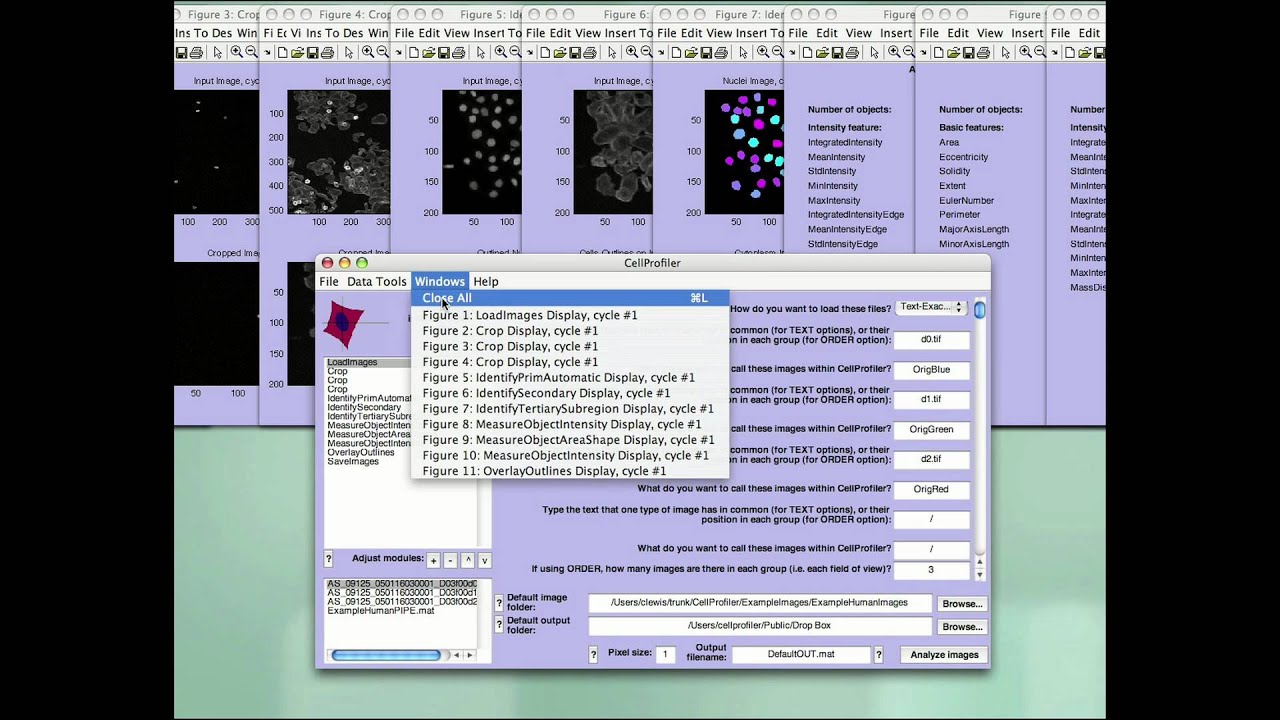
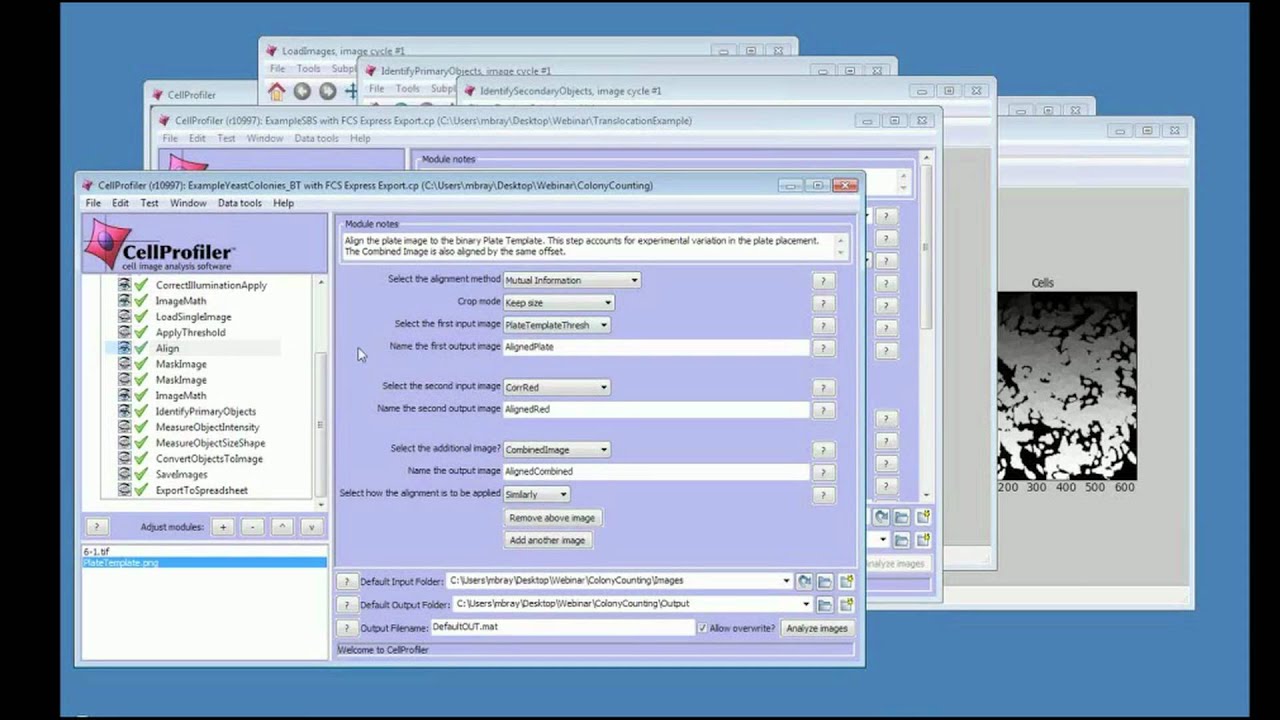
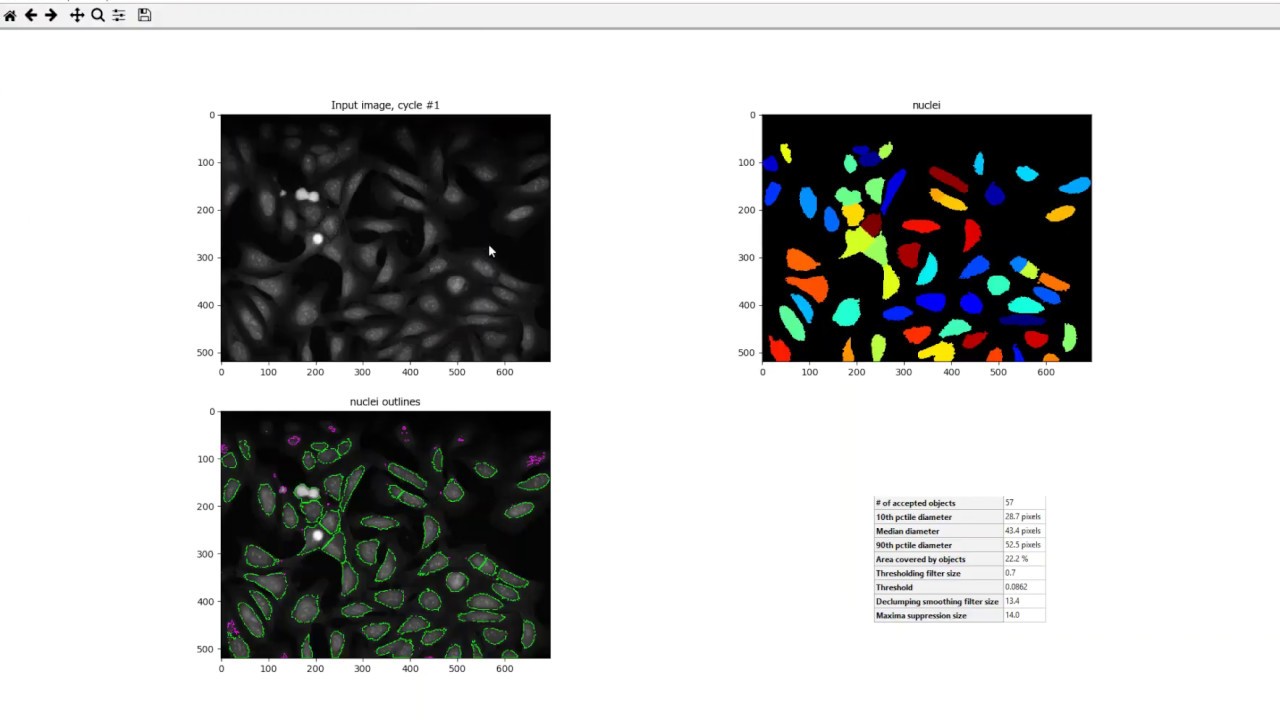
In this short movie, I will demonstrate the basics of using our software, from starting CellProfiler, opening images, changing directories, loading, creating, and saving pipelines, and where to go if you need help. To begin using CellProfiler, you start it just like you do any program. By double clicking the Main file, or running the executable from the command line, whichever you prefer. The best way to learn how to use CellProfiler is to load an example pipeline from our webpage an give it a try. All the images and pipelines I’ll be using in this demo can be downloaded from our webpage. First, let’s setup our default directories, so CellProfiler will know where the images to be analyzed are located and where the output files will be placed once the analyses are complete. The edit boxes for the image and output folders are located at the lower right in the main window. For this demo, I’ll be using a set of human cell data. Once I changed the image directory, you can see that on the lower left, all the files in the input directory are now listed. From here, you can take a look at any of the image files in the list box by double clicking on it. A new window will appear showing the image you selected and file name at the top. At the top right is the popup box which lets you view the data as stretched so that the brightest values is white and the darkest value is black, or raw, which lets you see the data as required originally. If this were a color image, there would also be RG and B check boxes to the right to look at each of the color channels separately or in combination. Now, at this point, we’re ready to load our pipeline for this particular dataset. A pipeline is a sequential set of individual imaging analysis modules. Each module performs a specific task, so by stringing them together in order, you have the capability of automatically analyzing your dataset. To load a pipeline, you can go to File Load Pipeline in the main menu of CellProfiler. Each pipeline is a MATLAB file that ends with the extension .mat. You can also load the pipeline by double clicking on the pipeline file in a directory listing. You can see the individual modules in a pipeline in a list box to the left. As you click on each module, the corresponding parameters that can be adjusted are shown on the right. Each module’s executed in order, starting from the top and working downwards. Now, to execute the loaded pipeline, click on Analyze Images down at the bottom right. As each module executes, a window opens so you can examine the performance of the module, its input, as well as its output. Also note that there’s a status window that shows the progress of the pipeline execution. Ok, now let’s get started on creating a pipeline of your own. First, I’m going to clear the windows and then clear the pipeline so I can start from scratch. A pipeline is constructed by placing modules together in order. From this demo, we’re going to make a very basic pipeline. We’re going to load in an image of a nuclear stain, identify the nuclei in the image, measure the shape an intensity of the nuclei, and then export the results. To add a module, click the plus button at the bottom of the module list. Now, typically the first module you want to put into place is the Load Images module. This module specific the identify of the images that you want to analyze. As we saw earlier, the first file in the directory was of a nuclear stain. The Load Images modules allows you to specify and load files for a particular text identifier in the name. In this case, the nuclear stain is a Tif file that ends with the letters d0.tif. So, I’ll specify that I’m looking for matching text, and tell the module that I’m looking for files that have d0.tif in the name. Once the image is loaded, the image needs to be identified with a specific name within CellProfiler, so we’ll leave the name at the default, Origblue, for now. Now we’re going to add a module for identifying objects. The module is called IdentifyAPrimaryAutomatic which will identify the nuclei based on a greyscale values in the image.
Повторяем попытку...
Доступные форматы для скачивания:
Скачать видео
-
Информация по загрузке:


![Massive Attack • Morcheeba • Portishead - Special Coffeeshop Selection [Seven Beats Music]](https://imager.clipsaver.ru/_gozzJ5Yjsc/max.jpg)