ycliper

Популярное

Музыка Кино и Анимация Автомобили Животные Спорт Путешествия Игры Юмор

Интересные видео

2025 Сериалы Трейлеры Новости Как сделать Видеоуроки Diy своими руками

Топ запросов

смотреть а4 schoolboy runaway турецкий сериал смотреть мультфильмы эдисон
Скачать

How to use scatter plots

Автор: Harvard Online

Загружено: 2017-04-19

Просмотров: 6562

Описание: From our free online course, “Practical Improvement Science in Health Care: A Roadmap for Getting Results”:
https://www.edx.org/course/ph556x-pra...

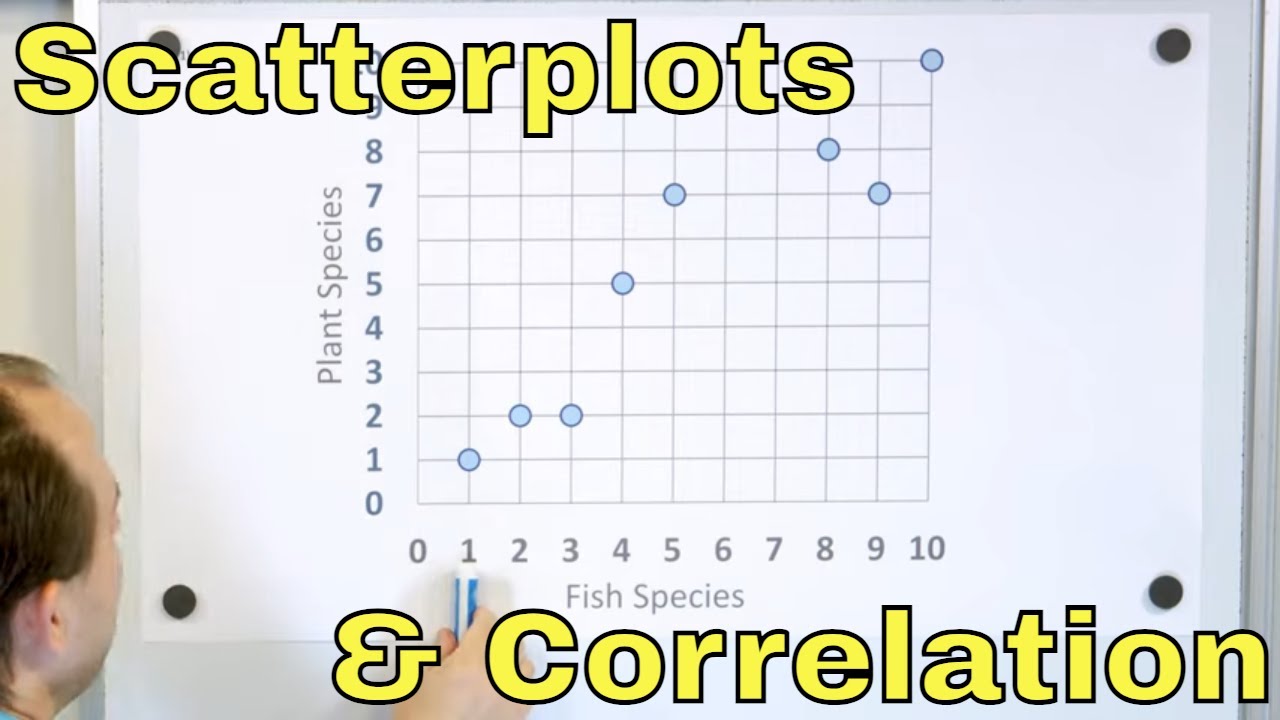
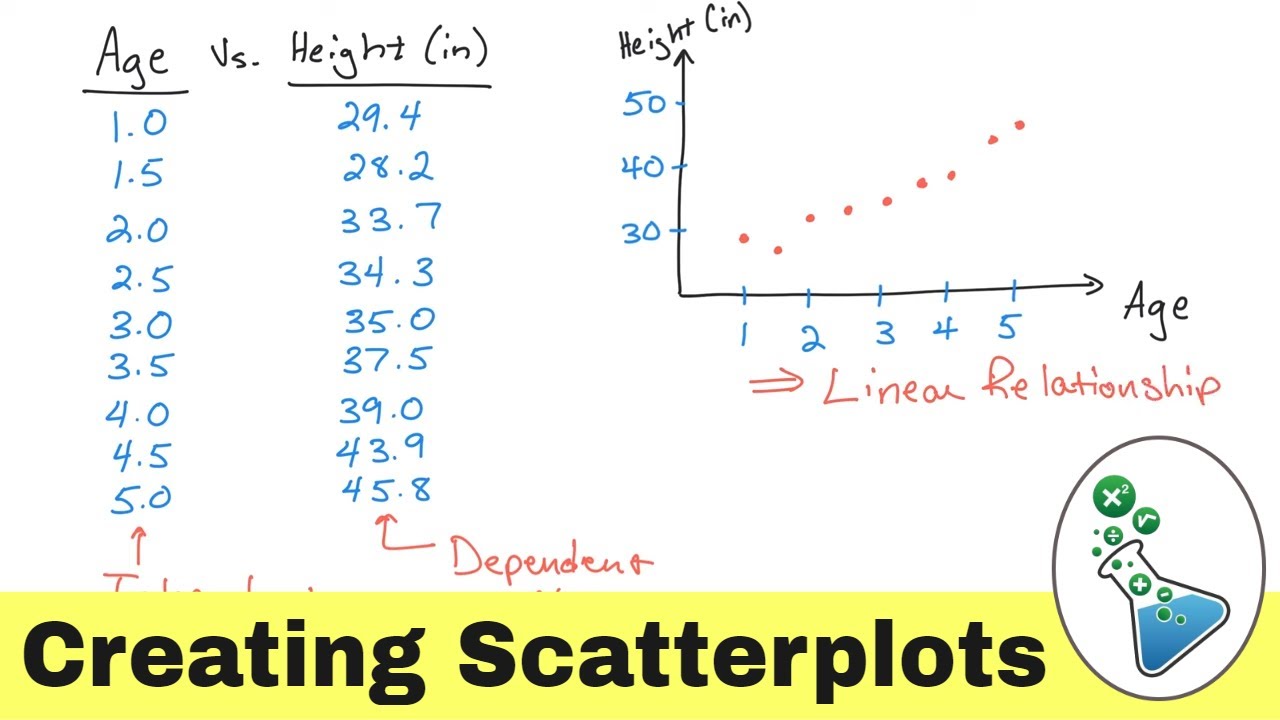
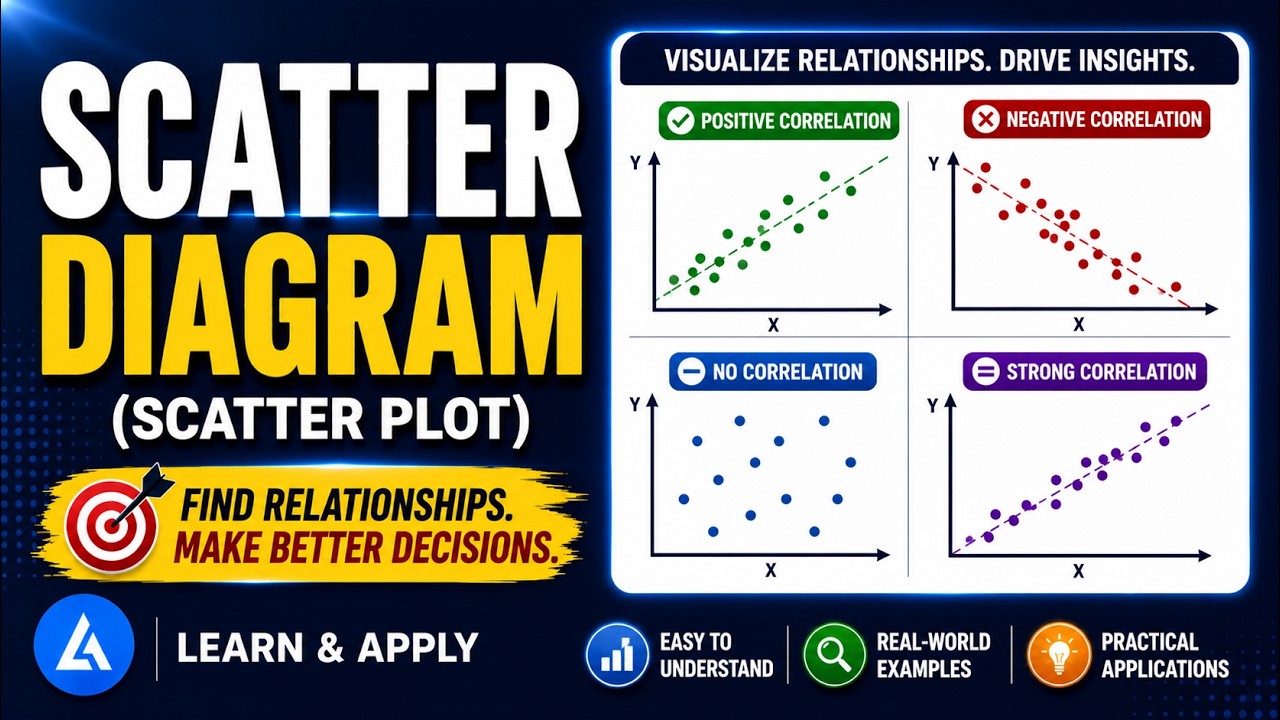
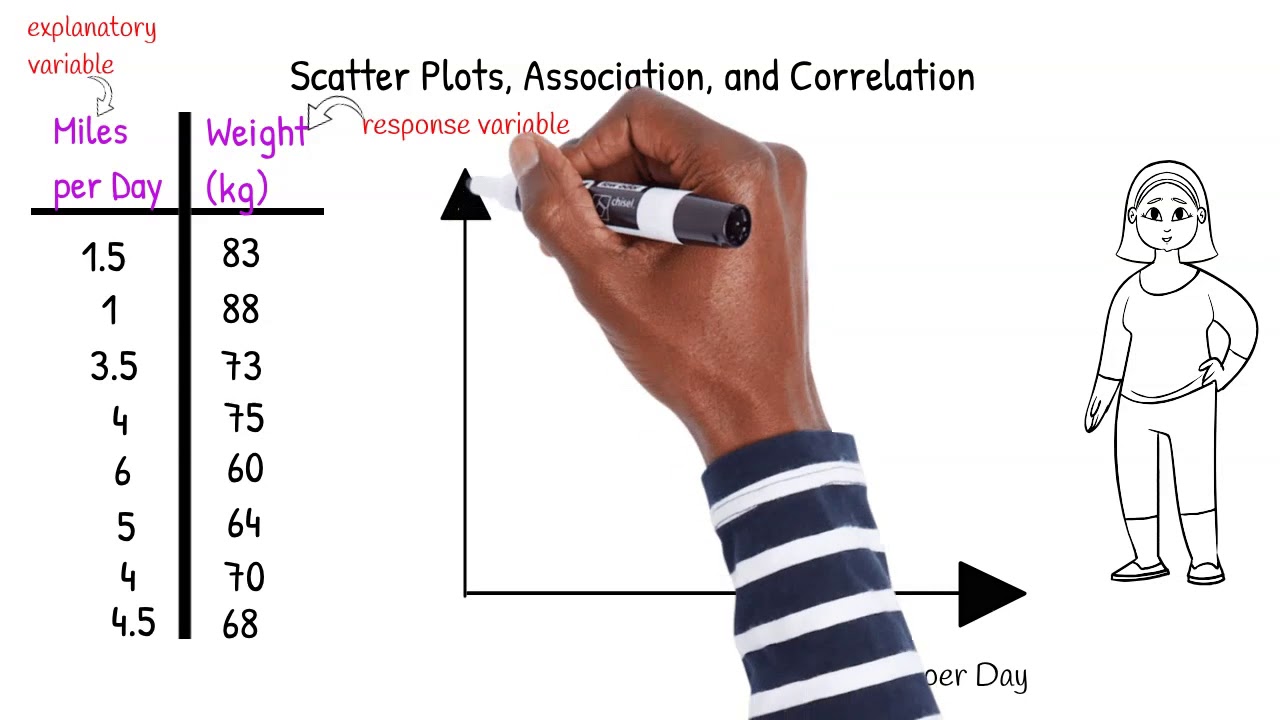
A scatter plot is a graphical tool used to examine the association between two variables. Scatter plots help us to see unusual patterns, data affected by special causes, and interesting clustering of data points. A scatter plot can also show how changes in process measures are affecting outcomes. Use a scatterplot when you want to determine the relationship between two different measures.

— Subscribe to our channel:    / @harvardonline  
— Sign up for emails about new courses: https://harvardx.link/email
— HarvardX courses on edX: https://www.edx.org/school/harvardx
— Harvard University's online courses: https://online-learning.harvard.edu/

HarvardX empowers the faculty of Harvard University to create high-quality online courses in subjects ranging from computer science to history, education, and religion.

Не удается загрузить Youtube-плеер. Проверьте блокировку Youtube в вашей сети.
Повторяем попытку...
How to use scatter plots

Поделиться в:

Доступные форматы для скачивания:

Скачать видео

  • Информация по загрузке:

Скачать аудио

Похожие видео

Статистика - Построение диаграммы рассеяния

Статистика - Построение диаграммы рассеяния

Как выбрать правильный график (типы графиков и когда их использовать)

Как выбрать правильный график (типы графиков и когда их использовать)

Построить диаграммы рассеяния и определить корреляцию (положительную и отрицательную корреляцию д...

Построить диаграммы рассеяния и определить корреляцию (положительную и отрицательную корреляцию д...

4 Hours Chopin for Studying, Concentration & Relaxation

4 Hours Chopin for Studying, Concentration & Relaxation

Савватеев разоблачает фокусы Земскова

Савватеев разоблачает фокусы Земскова

Що Герінг сказав перед смертю? Таємниці Нюрнберзького процесу | WAS

Що Герінг сказав перед смертю? Таємниці Нюрнберзького процесу | WAS

Вот как читать дифференциальные уравнения.

Вот как читать дифференциальные уравнения.

How to Think and How to Speak | Jordan Peterson and Lex Fridman

How to Think and How to Speak | Jordan Peterson and Lex Fridman

Easily Create Scatter Plots

Easily Create Scatter Plots

Normal Distribution in Python: A Beginner's Guide with Scipy & Numpy

Normal Distribution in Python: A Beginner's Guide with Scipy & Numpy

Python Machine Learning Tutorial (Data Science)

Python Machine Learning Tutorial (Data Science)

BroadE: Statistical Genetics - Rare variants

BroadE: Statistical Genetics - Rare variants

Scatter Graphs - Corbettmaths

Scatter Graphs - Corbettmaths

The Pareto Principle - 80/20 Rule - Do More by Doing Less (animated)

The Pareto Principle - 80/20 Rule - Do More by Doing Less (animated)

Matplotlib Tutorial (Part 7): Scatter Plots

Matplotlib Tutorial (Part 7): Scatter Plots

Scatter Diagram (Scatter Plot): Detailed Illustration With Examples

Scatter Diagram (Scatter Plot): Detailed Illustration With Examples

Four Stock Portfolio and Graphing Efficient Portfolio Frontier

Four Stock Portfolio and Graphing Efficient Portfolio Frontier

Scatter Plots, Association and Correlation

Scatter Plots, Association and Correlation

How to use a Pareto chart

How to use a Pareto chart

Diagrama de Dispersão (Ferramenta da Qualidade): Teoria + Exemplo no Excel

Diagrama de Dispersão (Ferramenta da Qualidade): Teoria + Exemplo no Excel

© 2025 ycliper. Все права защищены.


  • Контакты
  • О нас
  • Политика конфиденциальности


Контакты для правообладателей: [email protected]