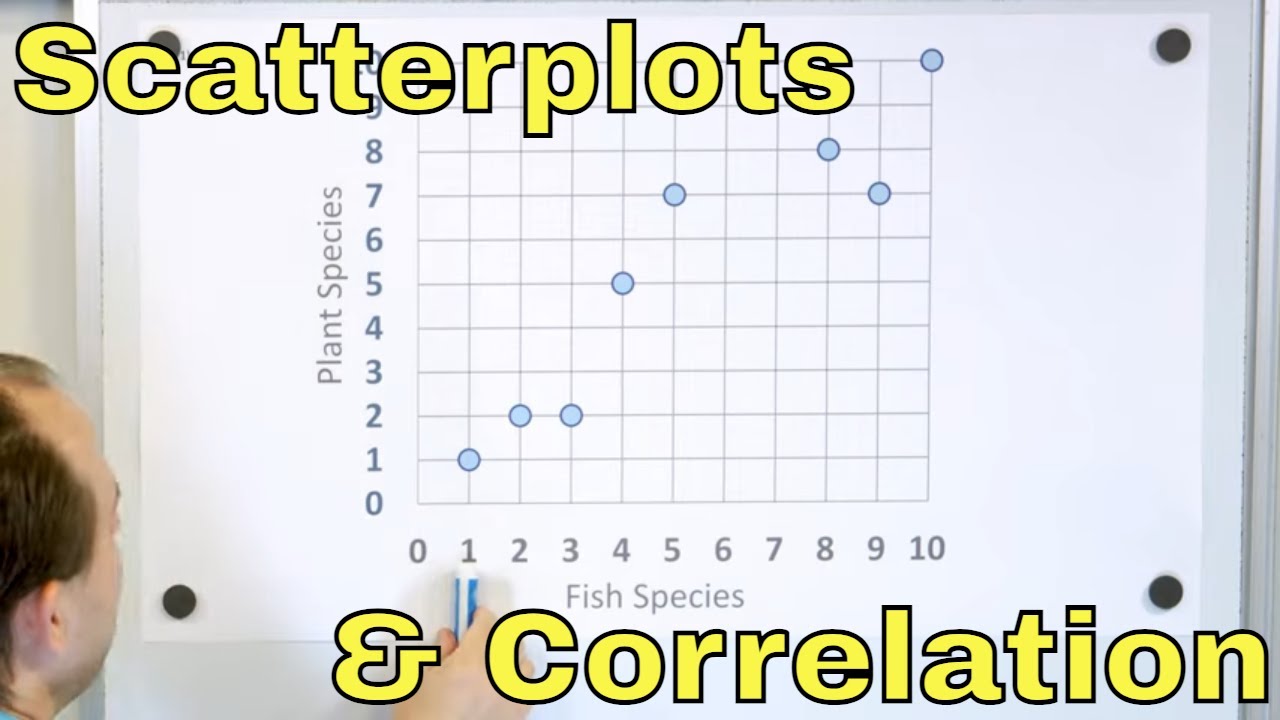
Easily Create Scatter Plots
Автор: Math and Science
Загружено: 2023-08-27
Просмотров: 1760
Описание:
Welcome to our comprehensive YouTube video on creating scatter plots! In this enlightening tutorial, we delve into the world of data visualization and equip you with the knowledge and techniques to confidently create and interpret scatter plots.
Whether you're a student studying statistics or a professional seeking effective data representation tools, this video is your ultimate guide to unlocking the power of scatter plots. Our expert instructor breaks down complex concepts into digestible explanations, ensuring that you grasp the essence of this crucial data visualization technique.
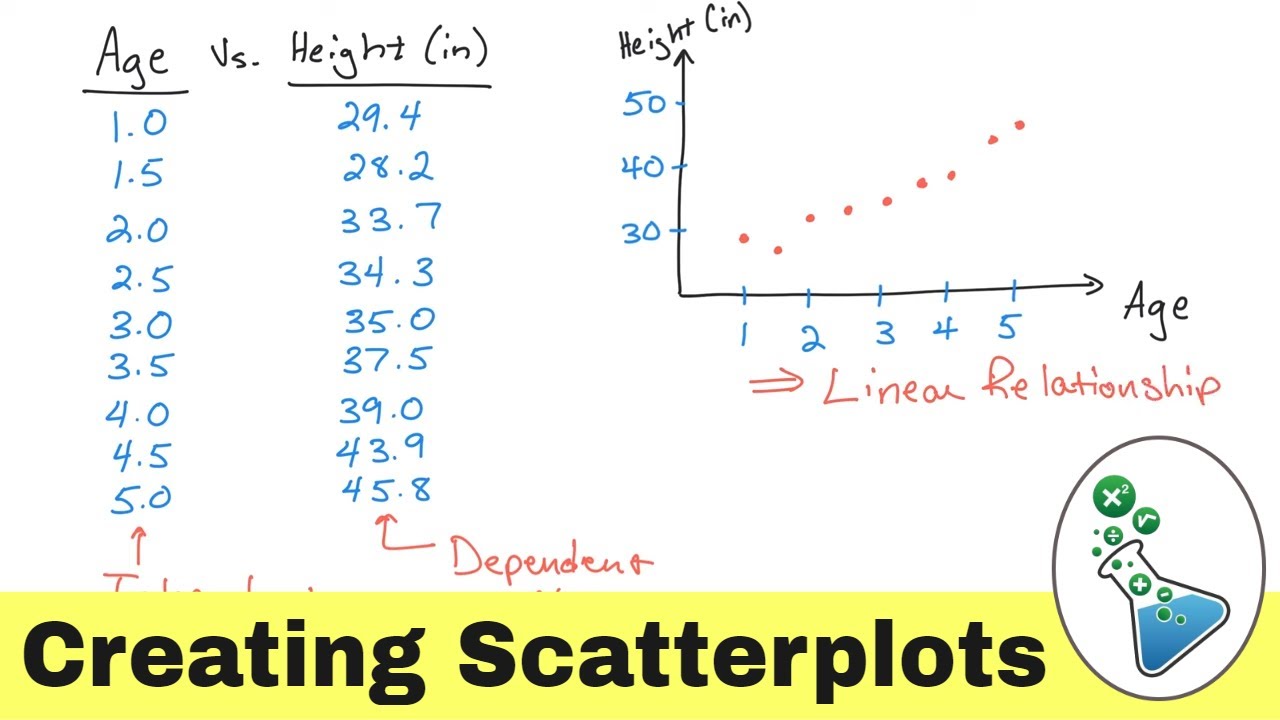
Join us as we explore practical strategies and techniques for creating scatter plots. We provide clear explanations and step-by-step instructions on selecting appropriate variables, plotting data points, choosing suitable scales, and adding labels and titles to enhance the interpretability of your scatter plot.
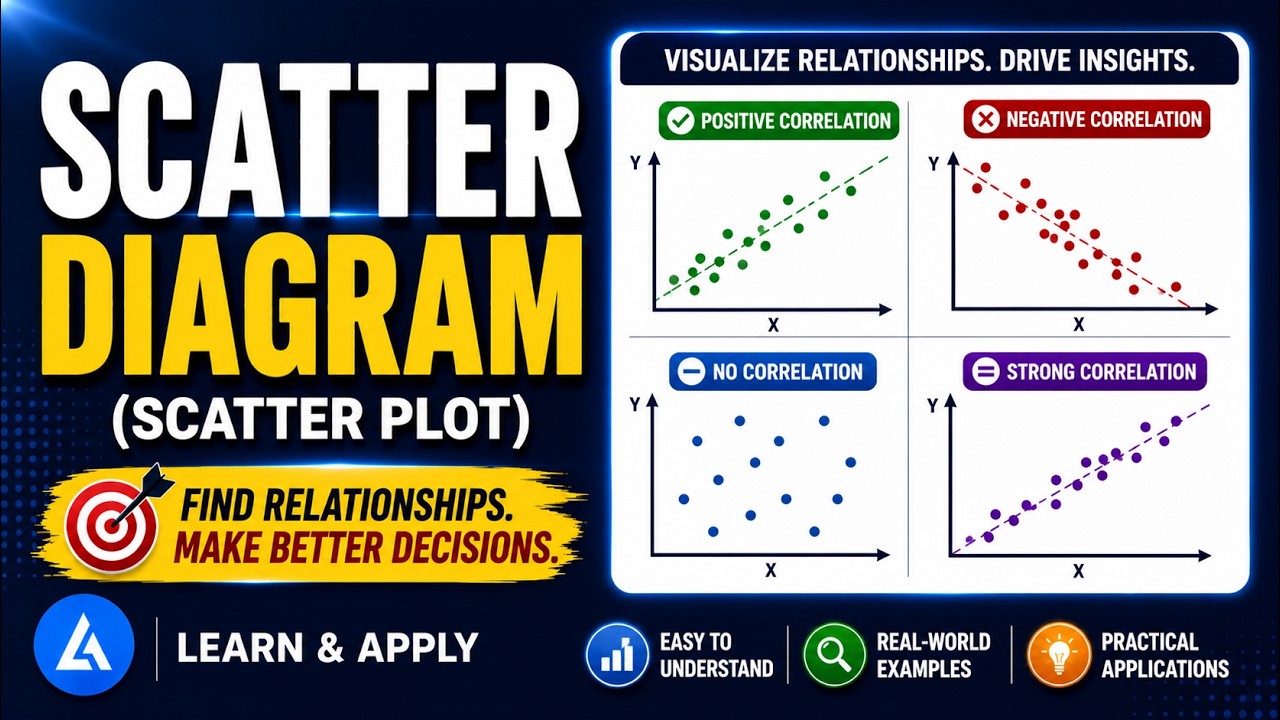
Through interactive visuals and illustrative examples, we tackle a variety of scenarios, from simple two-variable relationships to more complex multivariate data. We demonstrate how to identify patterns, trends, and correlations by analyzing the scatter plot structure.
With our comprehensive instructions and insightful examples, you'll develop a solid foundation in creating scatter plots. You'll gain the confidence to effectively visualize relationships between variables, detect outliers, and communicate your findings with clarity.
Don't let data visualization challenges hinder you any longer. Join us for this captivating tutorial and unlock the power to confidently create and interpret scatter plots. Hit that play button now and embark on your journey to becoming a master of visualizing relationships through scatter plots!
More Lessons: http://www.MathAndScience.com
Twitter: / jasongibsonmath
Повторяем попытку...
Доступные форматы для скачивания:
Скачать видео
-
Информация по загрузке:


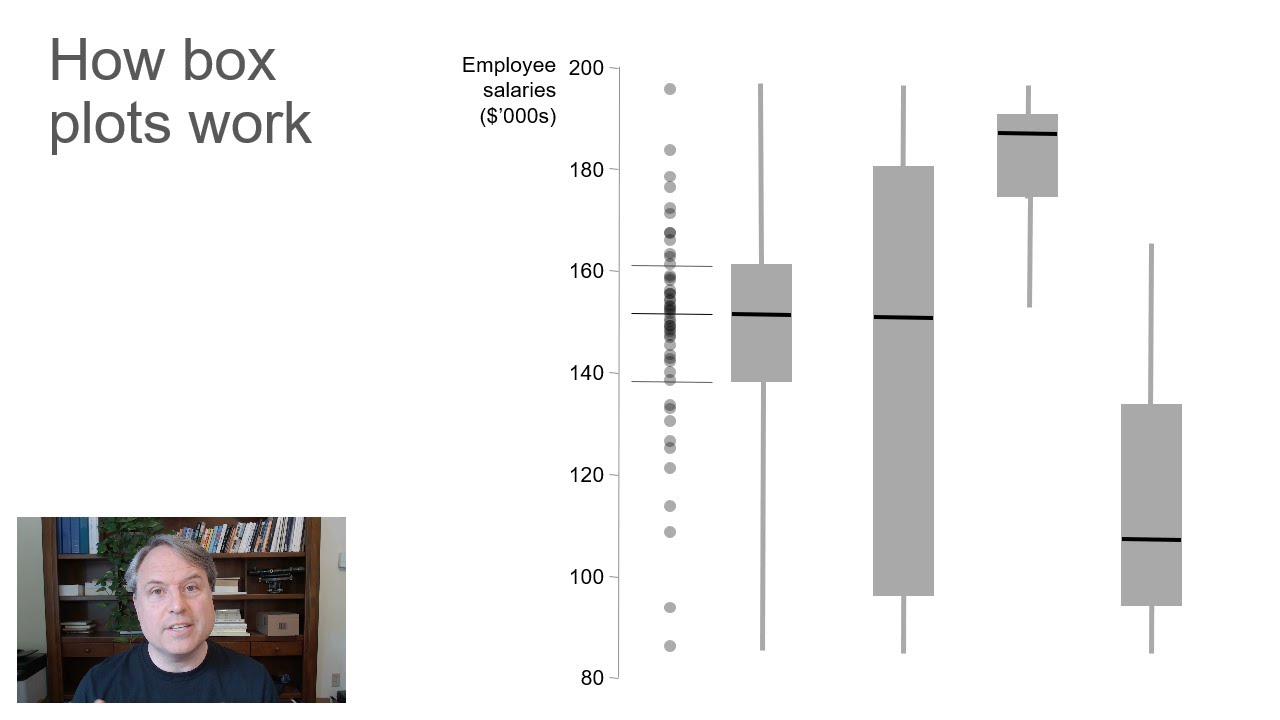


![Understand Box Plots in Statistics (Box-and-Whisker Plots) - [6-8-23]](https://imager.clipsaver.ru/cklvFT8dR64/max.jpg)