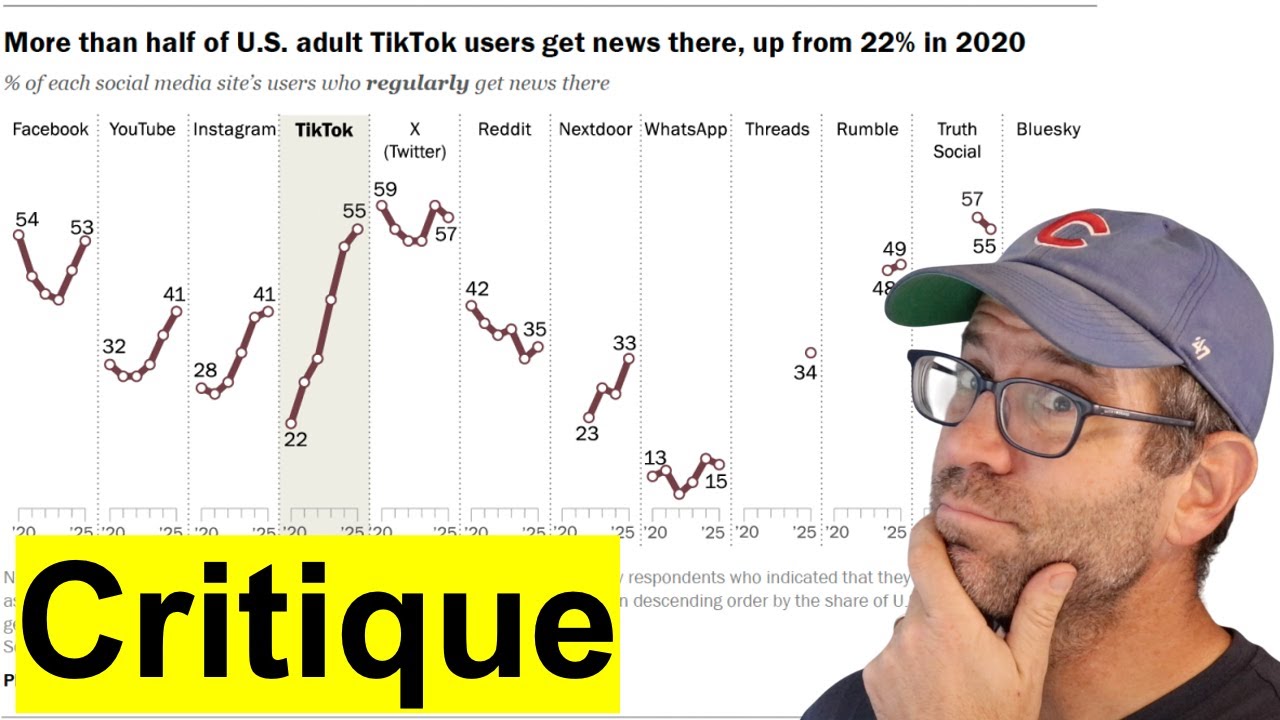
Data viz critique: Where are Americans getting their news from? (CC378)
Автор: Riffomonas Project
Загружено: 2025-11-03
Просмотров: 423
Описание:
Pat applies the DAIJ model for giving a critique to a data visualization from the Pew Research Center that shows that more than half of TikTok users are getting their news from the site. Does this visual support that assertion? By Describing, Analyzing, Interpreting, and then Judging the visual he contends that we can give a more constructive data visualization that will help the recipient and the person giving the critique get the most out of the experience. You can find the Pew Research article at https://www.pewresearch.org/short-rea....
Want more practice on the concepts covered in Code Club? You can sign up for my weekly newsletter at https://shop.riffomonas.org/youtube to get practice problems, tips, and insights. If you're interested in purchasing a video workshop be sure to check out https://riffomonas.org/workshops/
Support Riffomonas by becoming a Patreon member!
/ riffomonas
You can also find complete tutorials for learning R with the tidyverse using...
Microbial ecology data: https://www.riffomonas.org/minimalR/
General data: https://www.riffomonas.org/generalR/
If you want to cite this video, please consider citing https://journals.asm.org/doi/10.1128/...
0:00 Introduction
1:29 Description
6:31 Analysis
16:58 Interpretation
20:14 Judgement
Повторяем попытку...
Доступные форматы для скачивания:
Скачать видео
-
Информация по загрузке: