How overly precise P-values make data visualizations worse (CC385)
Автор: Riffomonas Project
Загружено: 2025-11-24
Просмотров: 948
Описание:
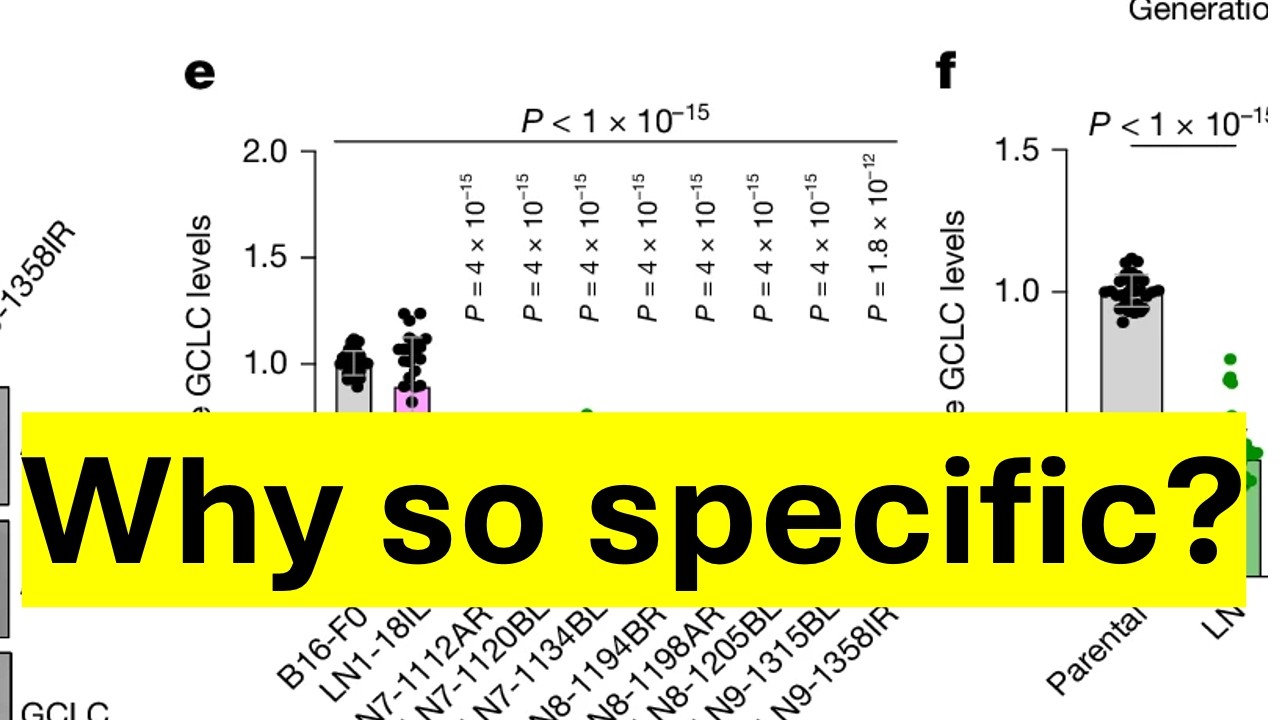
Pat critiques a figure from a paper published in the scientific journal Nature commenting on the problem of overly precise P-values and R2 values. He discusses the context of the article including its audience, venue, and biological question before moving on to discussing how the panels within the figure are composed. Finally, he discusses the limitation of the authors' approach and some alternatives that might have aligned better with the text and been easier for the audience to interpret. By Describing, Analyzing, Interpreting, and then Judging the visual he contends that we can give a more constructive data visualization that will help the recipient and the person giving the critique get the most out of the experience. You can freely access the article Pat discusses at https://www.nature.com/articles/s4158....
Want more practice on the concepts covered in Code Club? You can sign up for my weekly newsletter at https://shop.riffomonas.org/youtube to get practice problems, tips, and insights. If you're interested in purchasing a video workshop be sure to check out https://riffomonas.org/workshops/
Support Riffomonas by becoming a Patreon member!
/ riffomonas
You can also find complete tutorials for learning R with the tidyverse using...
Microbial ecology data: https://www.riffomonas.org/minimalR/
General data: https://www.riffomonas.org/generalR/
If you want to cite this video, please consider citing https://journals.asm.org/doi/10.1128/...
0:00 Introduction
1:09 Description
9:19 Analysis
21:56 Interpretation
25:32 Judgement
Повторяем попытку...
Доступные форматы для скачивания:
Скачать видео
-
Информация по загрузке: