SWOT River Volume Variations (rivers only)
Автор: NASA Scientific Visualization Studio
Загружено: 2026-03-04
Просмотров: 105
Описание:
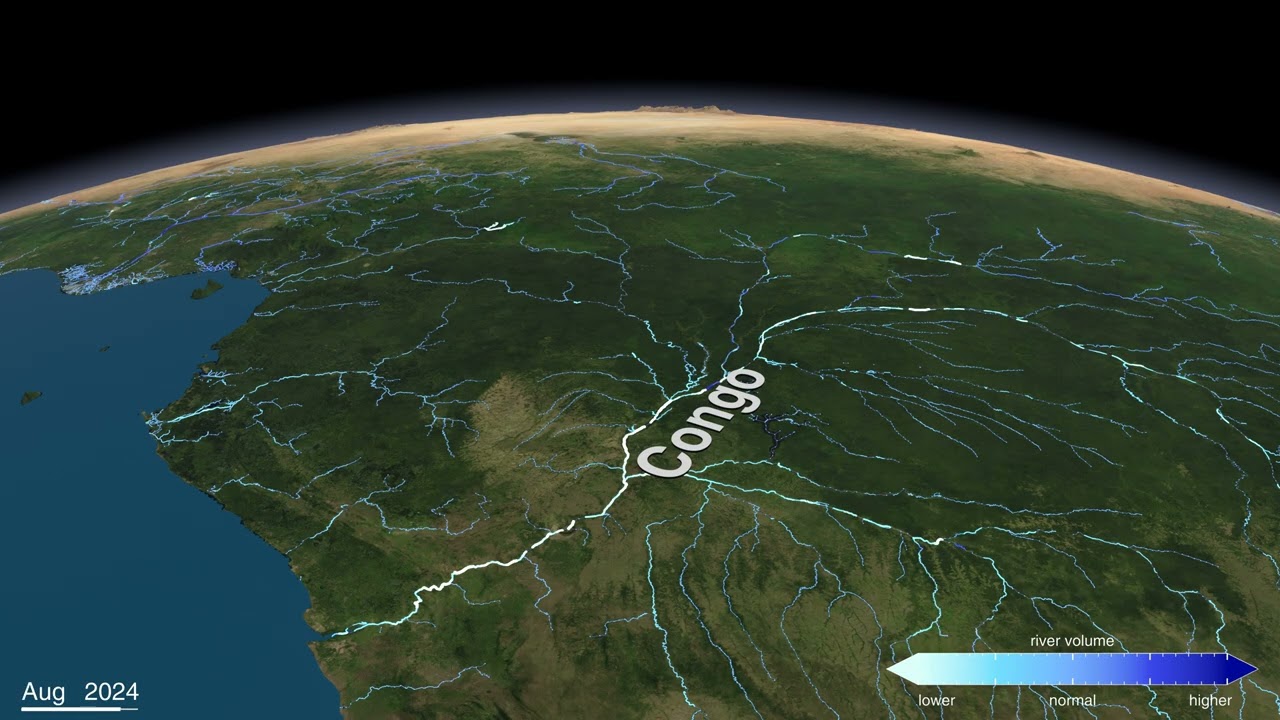
This is a visualization of changes in volume of the rivers of the world over the course of a year. The data show monthly river volumes anomalies. River volume is the total amount of water flowing through a channel per unit of time (e.g., cubic meters/second). River volume anomalies are just the difference in river volume from the normal river volume at each location. In this visualization, white represents lower than normal volume, cyan is normal volume, and blue is higher than normal volume. In the visualization, the river thicknesses are scaled for river volumes that are higher or lower than normal. The land data are monthly, showing the seasons as the land colors change and snow advances and retreats. This shows the strong correlation between river flows and the seasons.
The river volume data are monthly and span one year from October 2023 through September 2024. The data are interpolated to loop seamlessly. The volume data are separated into reaches, which are short sections of rivers and streams, typically around 10 kilometers in length. The reach data are mapped onto the higher resolution SWORD river database which has very high-resolution river paths.
There is another version of this visualization that includes the land and zooms into several different rivers. See: • SWOT River Volume Variations
See also: https://svs.gsfc.nasa.gov/5619
Credits:
Visualizations by:
Greg Shirah
Scientific consulting by:
Cedric David
and Arnaud Cerbelaud
Повторяем попытку...

Доступные форматы для скачивания:
Скачать видео
-
Информация по загрузке: