NASA Scientific Visualization Studio
NASA’s Scientific Visualization Studio (SVS) works closely with scientists to create visualizations of NASA data in order to promote a greater understanding of Earth and space science research activities at NASA and its collaborators. We are creating more and more of our content in 4K resolution and are starting to experiment in 360-degree visuals, so releasing material through YouTube will allow users greater ease and flexibility in using our visualizations. Starting in 2017, we plan on releasing all our new material here as well as on our website, https://svs.gsfc.nasa.gov .

NASA: Helping Communities Protect Drinking Water

How NASA Data Stabilizes Global Markets

NASA + Smithsonian and Greenhouse Gases

Exploring High-Resolution Sea Surface Height Data from NASA’s SWOT Satellite

Dylan Wootton, Massachusetts Institute of Technology

Swati Singh, Auburn University

Jorge Bravo, Stevens Institute of Technology

Crisel Suarez, Vanderbilt University
Marilee Karinshak, Washington University in St. Louis

Mya Thomas, University of Missouri-Kansas City

2024 AGU Michael H. Freilich Student Visualization Competition Grand Prize Winners, Wed. session

Patrick Kerwin

Caitlin Haedrich

2024 AGU Michael H. Freilich Student Visualization Competition Grand Prize Winners, Tue. session

Dr. Lisa Carnell

Dr. Joseph Westlake

Dr. Mark Clampin

Dr. Karen St. Germain

Dr. Shoshana Weider

Dr. Nicola Fox

PREFIRE First Light
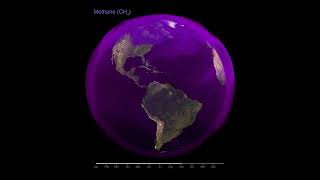
Global Atmospheric Methane (CH₄)

Trends in atmospheric Nitrous Oxide (N₂O)

Trends in atmospheric Methane (CH₄)

OCO-2 and Keeling Curve: Trends in global atmospheric Carbon Dioxide (CO₂)

50 Years of Harmful Algal Blooms: Rotating Globe Unwraps to Robinson Projection

Slow Reveal Graphs: Global Mean Sea Level 1993-2023

Change in Night Lights between 2012 and 2023 - EIC Version

Predicting Landslides

Wildfires101: Animations