How to Use AI to Visualize Complex Data for Non-Technical Stakeholders
Автор: Angel Reyes
Загружено: 2026-02-17
Просмотров: 8
Описание:
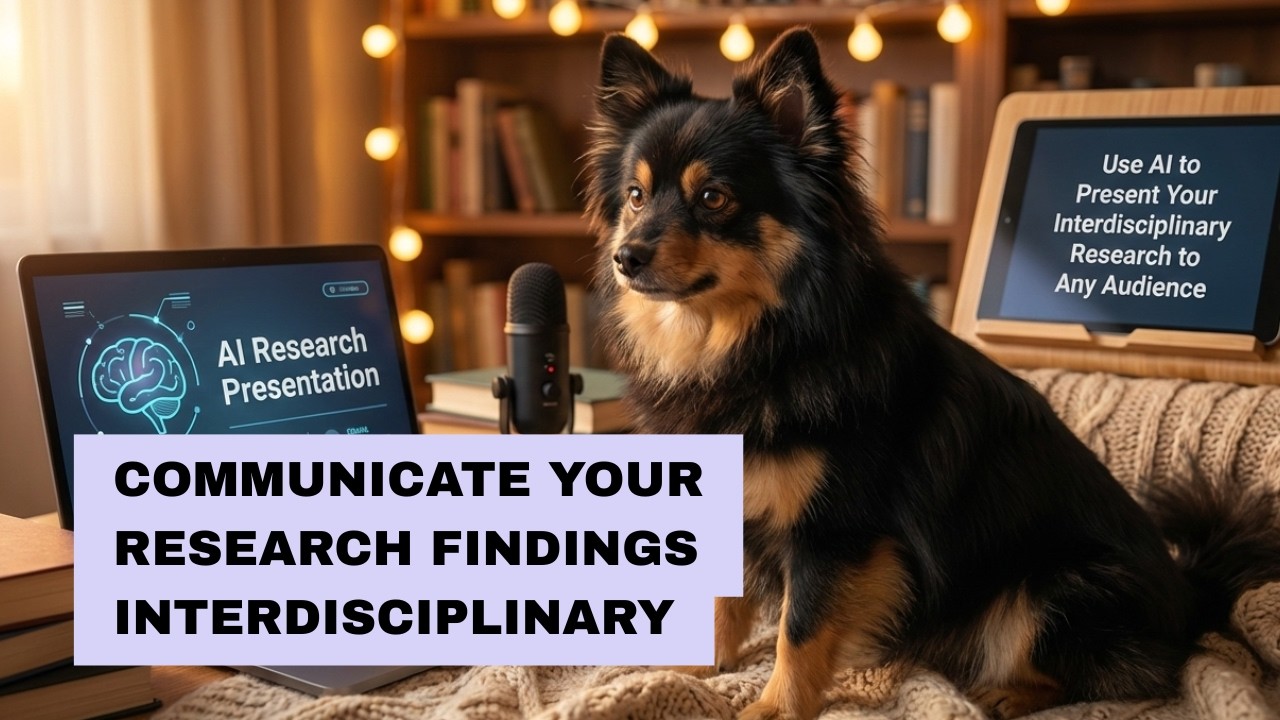
Use AI to transform complex statistical results into clear, accessible visualizations for policymakers, funders, and community partners who don't read forest plots or regression tables.
Why watch this video: Research impact requires communication beyond academia; AI visualization bridges the gap.
0:00 Introduction
---
Subscribe to Subthesis for weekly AI-powered research tips, tool tutorials, and workflow hacks for graduate students and researchers.
About Subthesis:
Your guide to integrating AI into academic research - from literature reviews to dissertation defense.
https://www.subthesis.com
#AIforResearch #PhDLife #GraduateSchool #AcademicAI #ResearchTools
Повторяем попытку...

Доступные форматы для скачивания:
Скачать видео
-
Информация по загрузке: