ycliper

Популярное

Музыка Кино и Анимация Автомобили Животные Спорт Путешествия Игры Юмор

Интересные видео

2025 Сериалы Трейлеры Новости Как сделать Видеоуроки Diy своими руками

Топ запросов

смотреть а4 schoolboy runaway турецкий сериал смотреть мультфильмы эдисон
Скачать

How to tell stories with data - Step by step chart makeover example

Автор: StoryIQ

Загружено: 2021-04-01

Просмотров: 19170

Описание: 
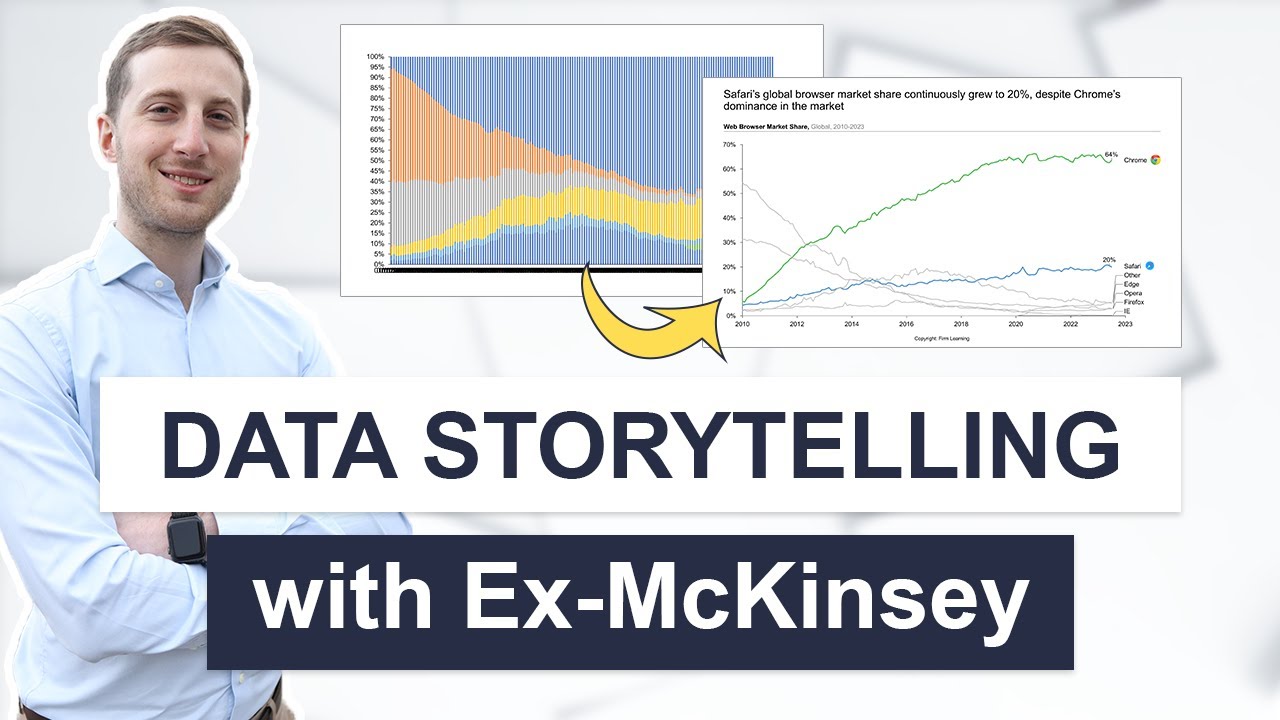
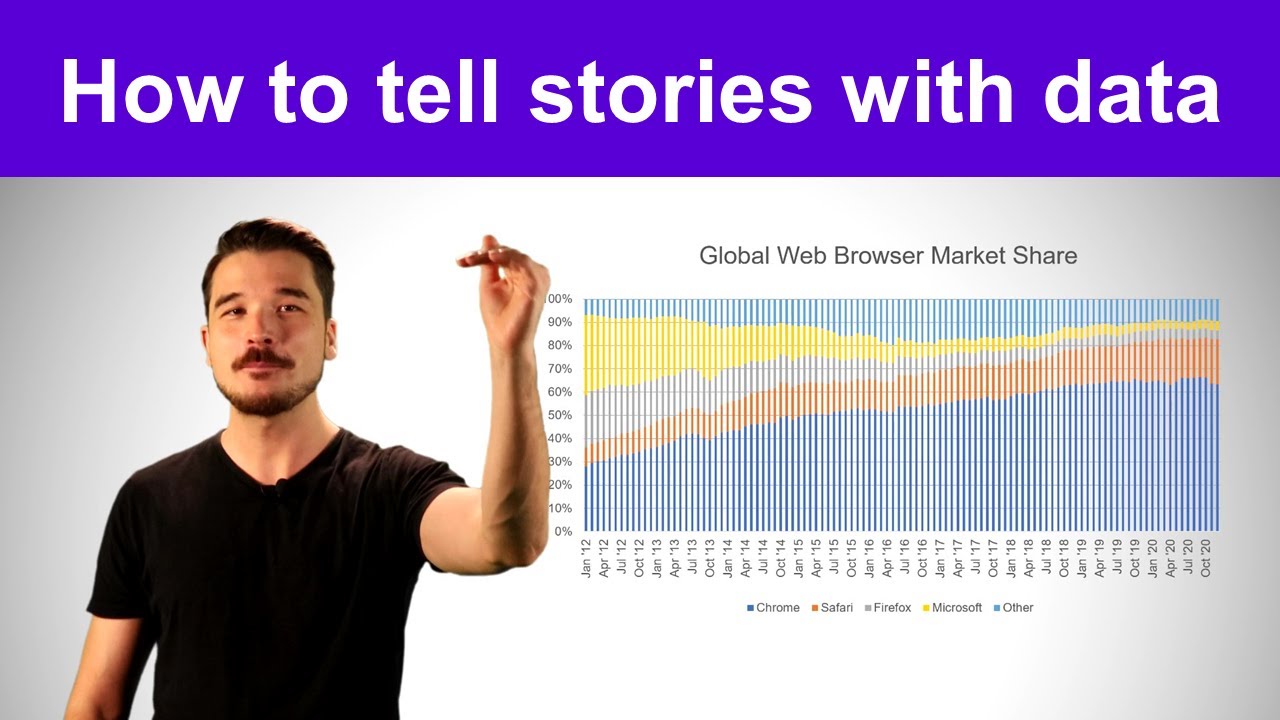
Let's transform a boring and confusing "data dump" into a compelling data story. StoryIQ Co-Founder Dominic Bohan will walk you through four critical steps to improve a visualization depicting the market share of web browsers.

1. Distill the most critical insights that your audience needs.
2. Display the data using the best visualization type to showcase your insights.
3. De-clutter and remove any distracting or unnecessary components from your visualization.
4. Direct your audience's attention to the most critical components of your visualization to support your key insights.

To read an article with step by step instructions, visit: https://storyiq.com/what-is-data-stor...

Не удается загрузить Youtube-плеер. Проверьте блокировку Youtube в вашей сети.
Повторяем попытку...
How to tell stories with data - Step by step chart makeover example

Поделиться в:

Доступные форматы для скачивания:

Скачать видео

  • Информация по загрузке:

Скачать аудио

Похожие видео

Stop Sharing Data—Start Telling Stories

Stop Sharing Data—Start Telling Stories

Telling a Story with Data | Dashboard Build Demo

Telling a Story with Data | Dashboard Build Demo

Преобразуйте информацию с панели управления в вдохновляющую историю

Преобразуйте информацию с панели управления в вдохновляющую историю

3 easy tips for annotating graphs

3 easy tips for annotating graphs

Telling Stories with Data - method 2 (The Discovery Journey method)

Telling Stories with Data - method 2 (The Discovery Journey method)

Storytelling with Data | Cole Nussbaumer Knaflic | Talks at Google

Storytelling with Data | Cole Nussbaumer Knaflic | Talks at Google

Рассказывание данных: как превратить данные в решения

Рассказывание данных: как превратить данные в решения

Ten considerations when designing a graph

Ten considerations when designing a graph

Storytelling with Data (Crash Course)

Storytelling with Data (Crash Course)

Dan Harmon Story Circle: 8 Proven Steps to Better Stories

Dan Harmon Story Circle: 8 Proven Steps to Better Stories

Crafting Stories with Data | Google Data Analytics Certificate

Crafting Stories with Data | Google Data Analytics Certificate

The simple genius of a good graphic | Tommy McCall

The simple genius of a good graphic | Tommy McCall

Make Beautiful Excel Charts Like The Economist (file included)

Make Beautiful Excel Charts Like The Economist (file included)

Визуализация данных: повествование с помощью данных

Визуализация данных: повествование с помощью данных

Turning Bad Charts into Compelling Data Stories | Dominic Bohan | TEDxYouth@Singapore

Turning Bad Charts into Compelling Data Stories | Dominic Bohan | TEDxYouth@Singapore

КАК УЛУЧШИТЬ СВОИ НАВЫКИ РАССКАЗА С ИСПОЛЬЗОВАНИЕМ ДАННЫХ С КОУЛОМ НАССБАУМЕРОМ КНАФЛИКОМ

КАК УЛУЧШИТЬ СВОИ НАВЫКИ РАССКАЗА С ИСПОЛЬЗОВАНИЕМ ДАННЫХ С КОУЛОМ НАССБАУМЕРОМ КНАФЛИКОМ

Визуализация данных для слайдовых презентаций — повествование, диаграммы, форматирование

Визуализация данных для слайдовых презентаций — повествование, диаграммы, форматирование

The importance of contrast when communicating with data.

The importance of contrast when communicating with data.

Uncover the insights from this busy bar chart!

Uncover the insights from this busy bar chart!

Data Storytelling Basics (in 3 Steps): How to Communicate Data and Numbers

Data Storytelling Basics (in 3 Steps): How to Communicate Data and Numbers

© 2025 ycliper. Все права защищены.


  • Контакты
  • О нас
  • Политика конфиденциальности


Контакты для правообладателей: [email protected]