ycliper

Популярное

Музыка Кино и Анимация Автомобили Животные Спорт Путешествия Игры Юмор

Интересные видео

2025 Сериалы Трейлеры Новости Как сделать Видеоуроки Diy своими руками

Топ запросов

смотреть а4 schoolboy runaway турецкий сериал смотреть мультфильмы эдисон
Скачать

Uncover the insights from this busy bar chart!

Автор: storytelling with data

Загружено: 2024-04-16

Просмотров: 4576

Описание: 
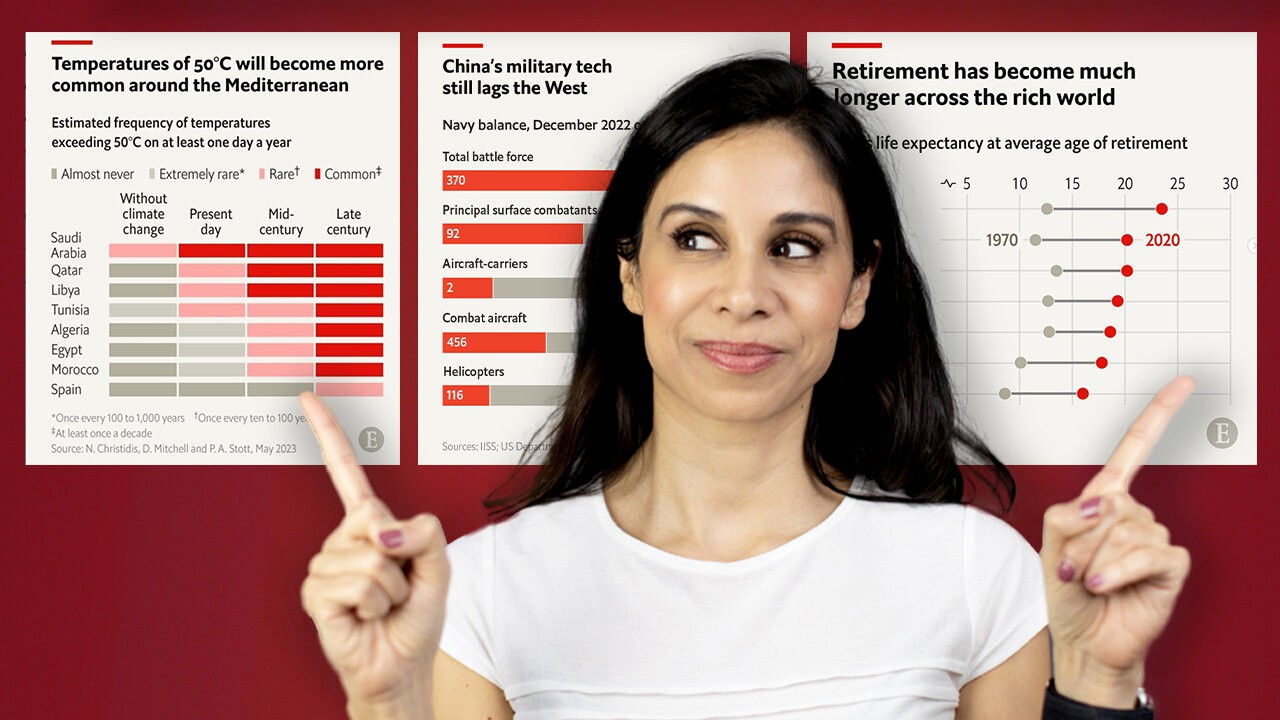
When communicating data, especially in a business setting, starting with simple visuals like bar charts is a great place to begin. Relying on our tools graphing defaults or attempting to populate too much data into our graphs, however, can lead to an overwhelming visual which is difficult to process.

This video takes a look at a busy bar graph and steps through the goals of this piece of analysis before exploring different ways to present this data. Using a different approach to grouping the bars and two different versions of line charts an actionable insight is discovered, and presented, to our audience.

JUMP TO THE SECTION THAT INTERESTS YOU
00:00 Intro
00:26 Example introduction
01:47 Goals of the analysis
02:46 Change the grouping of the bars
04:22 Switching to a series of line charts
06:31 Moving to one continuous line chart
07:09 Final version and wrap-up

BROWSE RELATED RESOURCES
● Pushed for time? - Watch the short which covers this transformation -    • Transform a busy bar chart!  

IMPROVE YOUR DATA VISUALIZATION & STORYTELLING SKILLS

INTRODUCING OUR NEW BOOK - AVAILABLE TO PREORDER
📚 STORYTELLING WITH DATA: BEFORE & AFTER
Packed with real-world makeovers and practical strategies, through twenty powerful transformations, watch ineffective charts evolve into engaging visuals that captivate, inform, and lead to smarter decisions—preorder now! https://amzn.to/3QNJtyV

STAY CONNECTED
👉 Sign up for our newsletter to be notified about new content and offerings. https://storytellingwithdata.com/news...

Не удается загрузить Youtube-плеер. Проверьте блокировку Youtube в вашей сети.
Повторяем попытку...
Uncover the insights from this busy bar chart!

Поделиться в:

Доступные форматы для скачивания:

Скачать видео

  • Информация по загрузке:

Скачать аудио

Похожие видео

Improve this graph!

Improve this graph!

3 easy tips for annotating graphs

3 easy tips for annotating graphs

Every Chart Type Ranked — What to Use and What to Avoid

Every Chart Type Ranked — What to Use and What to Avoid

Transform this data table - three different scenarios!

Transform this data table - three different scenarios!

transform: a storytelling with data mini-workshop

transform: a storytelling with data mini-workshop

🚨 ВЫ НЕПРАВИЛЬНО ПРЕДСТАВЛЯЕТЕ СВОИ ДАННЫЕ. И вот почему...

🚨 ВЫ НЕПРАВИЛЬНО ПРЕДСТАВЛЯЕТЕ СВОИ ДАННЫЕ. И вот почему...

Обзорная страница KPI в Power BI, которая привела моего клиента в полный восторг.

Обзорная страница KPI в Power BI, которая привела моего клиента в полный восторг.

Make Beautiful Excel Charts Like The Economist (file included)

Make Beautiful Excel Charts Like The Economist (file included)

Storytelling with Data (Crash Course)

Storytelling with Data (Crash Course)

Так из чего же состоят электроны? Самые последние данные

Так из чего же состоят электроны? Самые последние данные

Создание маркированных диаграмм в Excel (три версии!)

Создание маркированных диаграмм в Excel (три версии!)

Data viz makeovers: a craveberry case study

Data viz makeovers: a craveberry case study

My Top 8 Data Storytelling Tips as a Data Analyst

My Top 8 Data Storytelling Tips as a Data Analyst

NotebookLM: большой разбор инструмента (12 сценариев применения)

NotebookLM: большой разбор инструмента (12 сценариев применения)

Bar chart with differences in Excel

Bar chart with differences in Excel

How I fixed these data-heavy slides from McKinsey, BCG, and Bain

How I fixed these data-heavy slides from McKinsey, BCG, and Bain

Make Awesome Excel Visuals like The Economist Magazine

Make Awesome Excel Visuals like The Economist Magazine

10 лет рисовал логотипы и вот что понял

10 лет рисовал логотипы и вот что понял

Line graphs & slopecharts: what you should know

Line graphs & slopecharts: what you should know

Data storyteller improves PIE CHARTS | EP.4 Where are your eyes drawn?

Data storyteller improves PIE CHARTS | EP.4 Where are your eyes drawn?

© 2025 ycliper. Все права защищены.


  • Контакты
  • О нас
  • Политика конфиденциальности


Контакты для правообладателей: [email protected]