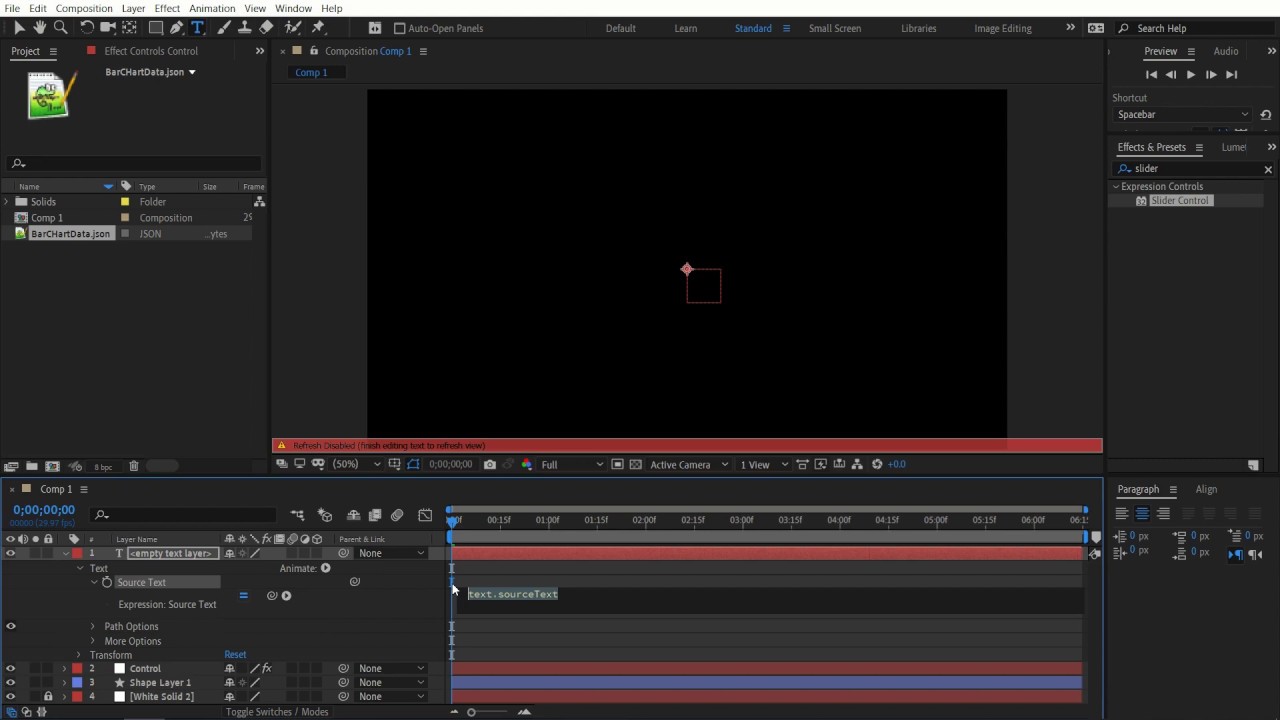
Automating Mograph in After Effects Data Driven Bar Graphs
Автор: Maxon Training Team
Загружено: 2020-08-06
Просмотров: 1065
Описание:
Combining Red Giant Universe (Progresso, HUD, KLF Progresso, Array Gun) and useful expressions that allow easier control of on-screen elements, with specialist sports production instructor Jason Hare.
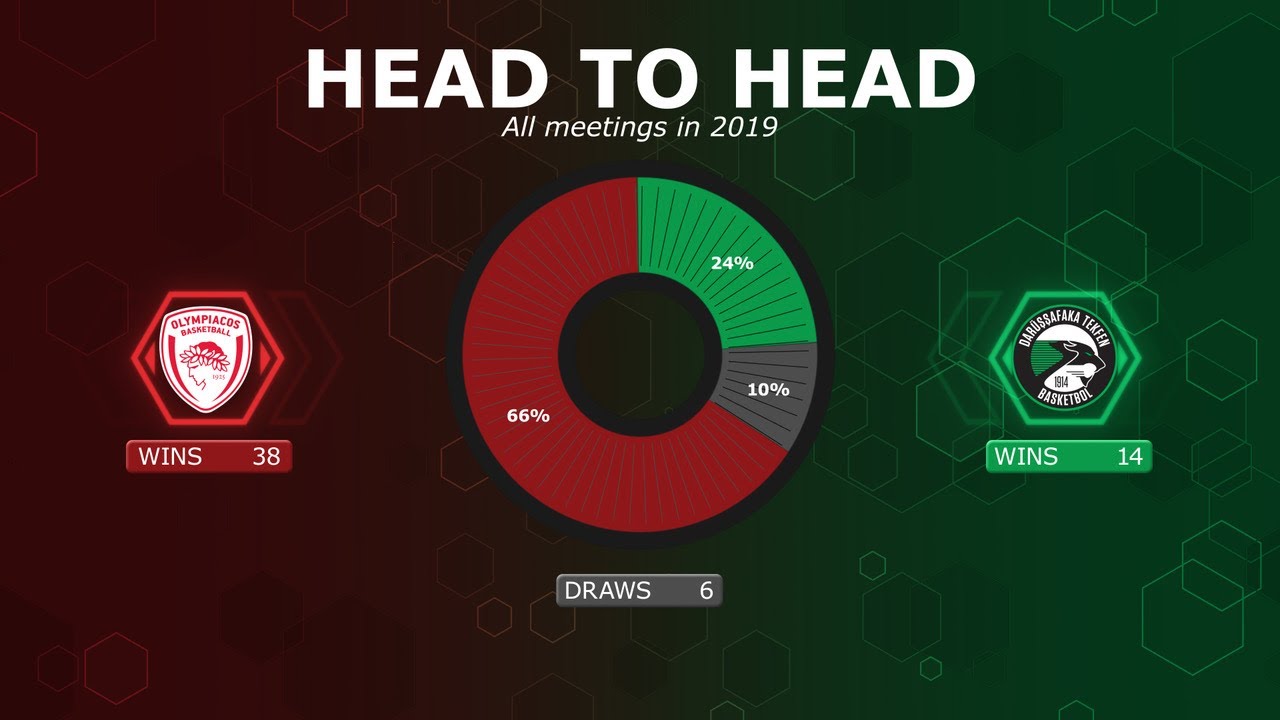
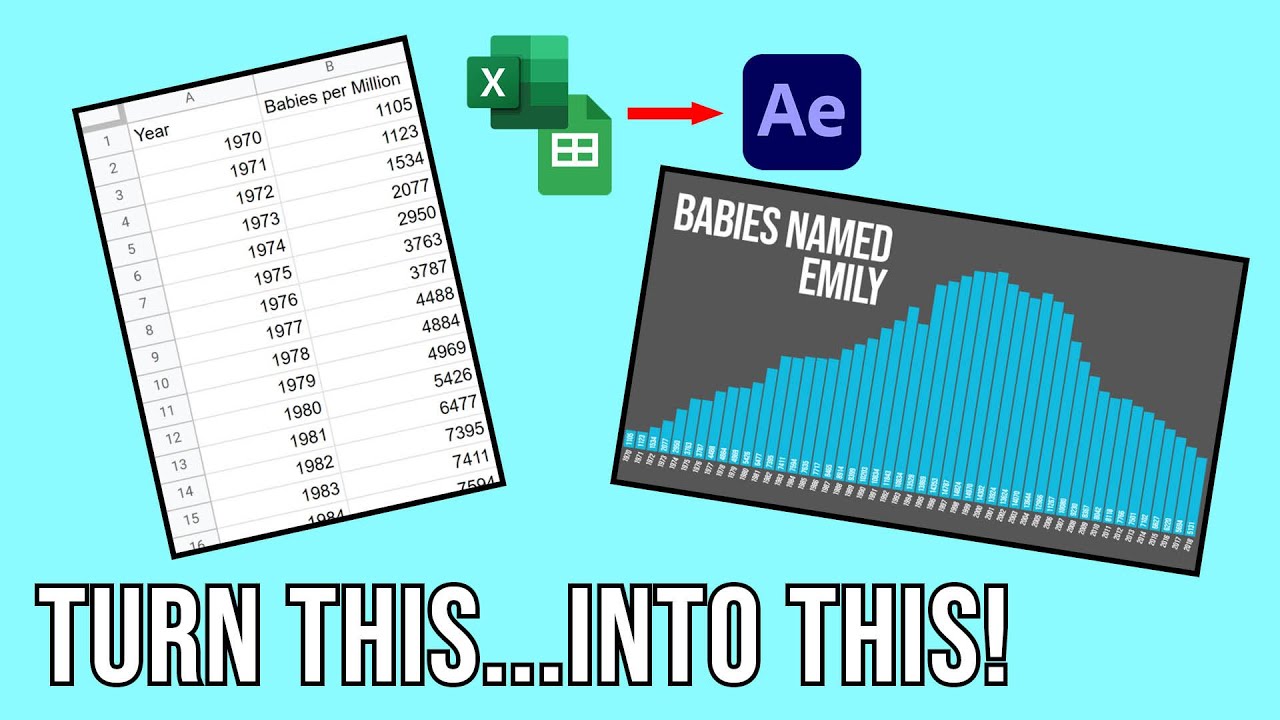
"For the third session we use Progresso to create a five statistic bar graph. This can be very useful in sports statistics as it is so customisable. Firstly, each statistic can be named as required. The numbers entered into the system can be represented either as number of a percentage value can be calculated. A percentage sign can be turned on and off and decimal places defined for each statistic independently. Finally we take this one step further and utilise the data driven templates to allow the graphic to updated by a simple CSV spreadsheet. This means a production assistant can be preparing the data for the graphic while the editor is free to do what they do best."
Webinar attendee comments:
"The past three days have been incredible. My mind is racing with ideas of how we can implement these techniques"
"Mind Blown!!"
Linked mentioned in the webinar:
Jason's AE Project File: https://bit.ly/RG-Stats-Project-File
https://aescripts.com/pt_expressedit/
https://www.redgiant.com/blog/2020/04...
https://www.redgiant.com/tutorial/get...
https://www.redgiant.com/tutorial/get...
https://www.redgiant.com/tutorial/get...
Повторяем попытку...

Доступные форматы для скачивания:
Скачать видео
-
Информация по загрузке: