Скачать
Heating Curve Experiment Simulation
Автор: Doug Adomatis
Загружено: 2021-01-20
Просмотров: 1802
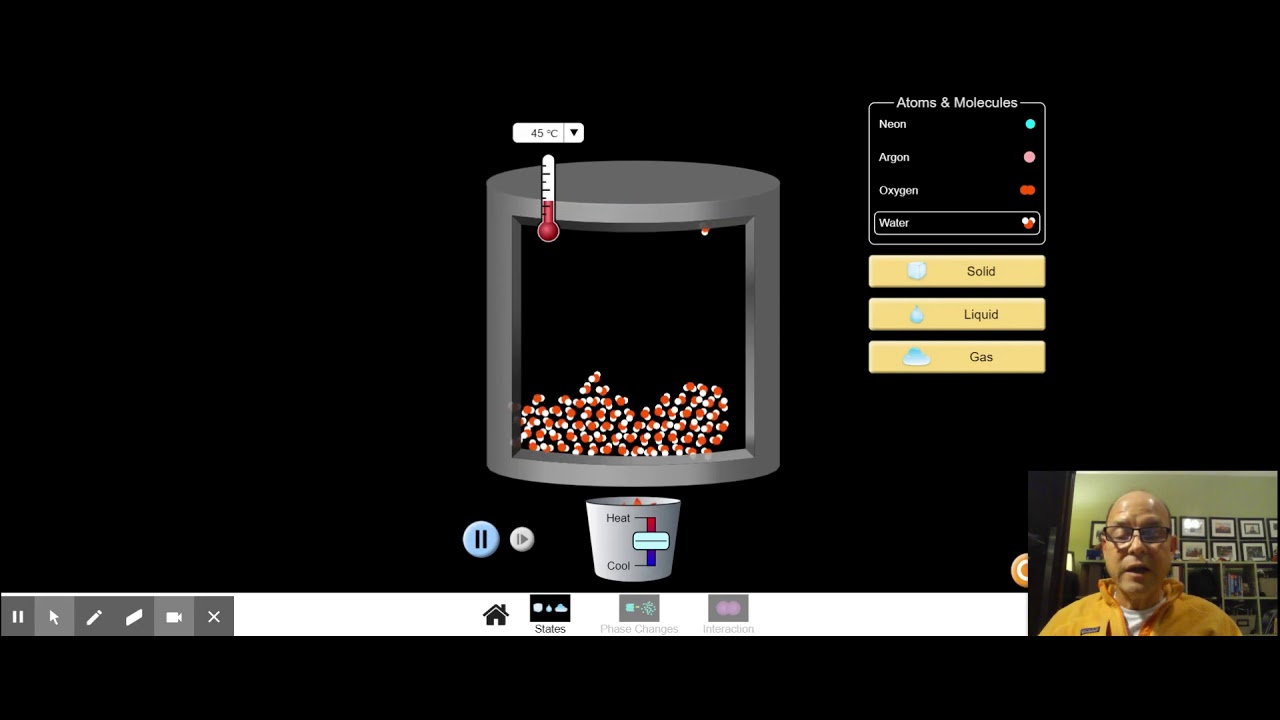
Описание: Mr. A uses the PhET "States of Matter" simulator to generate data for drawing a heating curve. Starting with water in the solid state, he applies a constant amount of heat to raise the temperature. You will start, stop, rewind, the video as necessary, in order to record temp vs time data. Use a stopwatch or timer app. Record the time and temperature at regular intervals on a data table. Graph the data with the temp on the vertical axis and time on the horizontal axis. What do you notice about the shape of the curve?
Не удается загрузить Youtube-плеер. Проверьте блокировку Youtube в вашей сети.
Повторяем попытку...
Повторяем попытку...
Доступные форматы для скачивания:
Скачать видео
-
Информация по загрузке: