How to create a bar chart race using Python in 2023
Автор: Sjoerd Tilmans
Загружено: 2023-06-28
Просмотров: 15628
Описание:
Link to the full course on Udemy: https://www.sjdataviz.com/course-link
GitHub link to sjvisualizer: https://github.com/SjoerdTilmans/sjvi...
Link to download course content: https://github.com/SjoerdTilmans/sj-d...
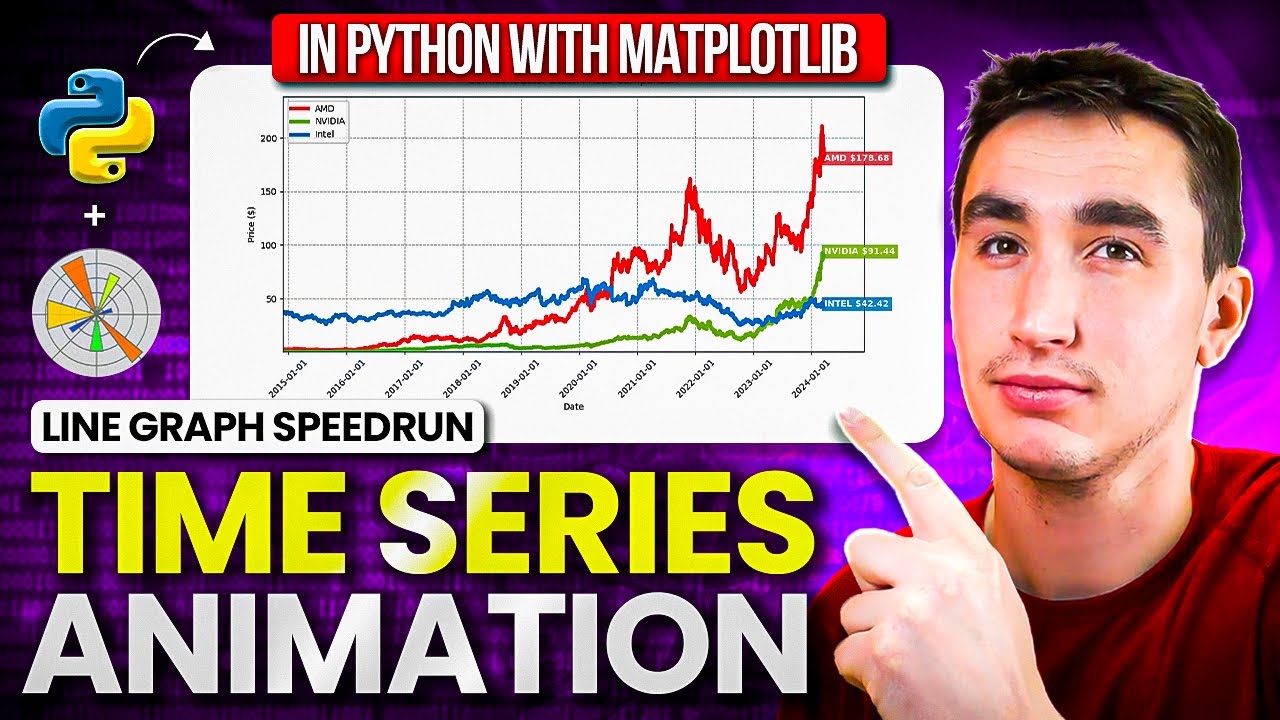
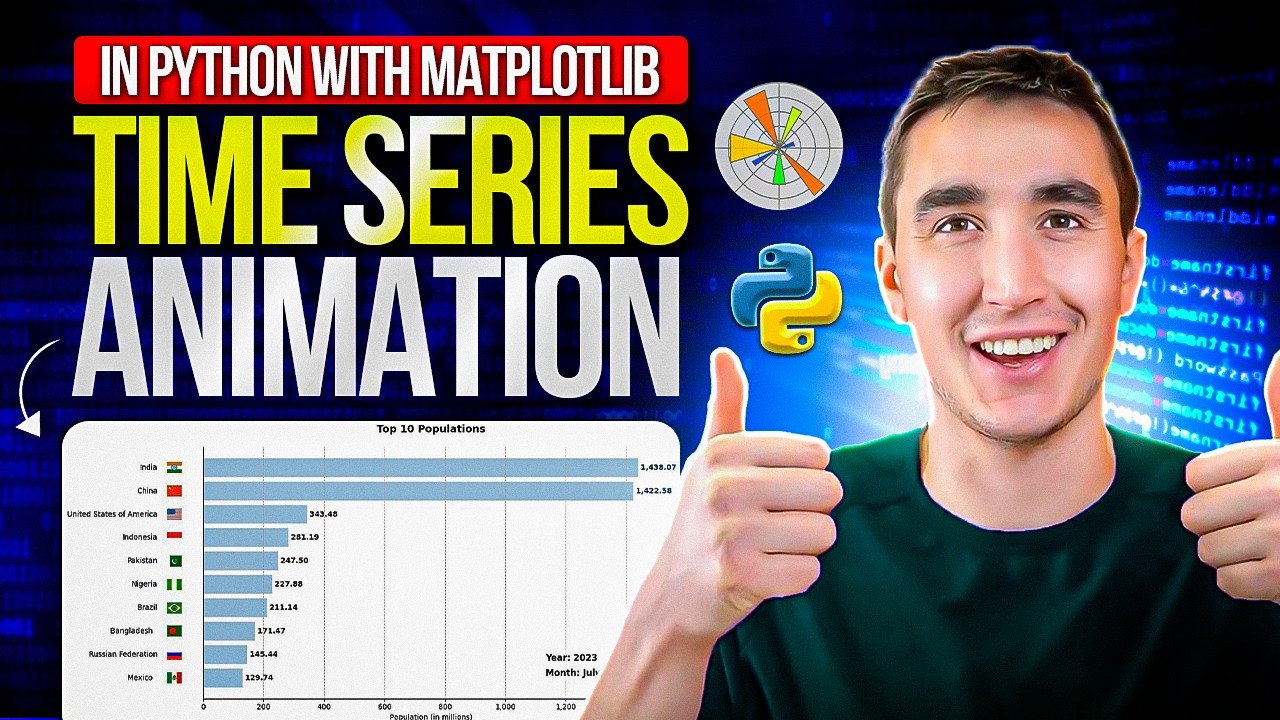
In this video I will show you how to make your own racing bar chart with Python and sjvisualizer!
0:00 Intro
0:07 Installation of python, jupyter notebook and sjvisualizer
0:54 Preparing the working directory
1:14 Preparing the data
1:59 Import the data
3:38 Creating the sjvisualizer canvas
4:06 How to add a bar race using sjvisualizer
5:15 Adding a title and time indication using sjvisualizer
6:08 The official sjvisualizer course on udemy
6:30 How to change the colors in sjvisualizer
8:26 How to add custom icons in sjvisualizer
Повторяем попытку...

Доступные форматы для скачивания:
Скачать видео
-
Информация по загрузке: