Office 2016 | Data Plotting on 3-D Maps | Plot charts on maps in Excel
Автор: TrueDiscover
Загружено: 2015-09-03
Просмотров: 14242
Описание:
In this lesson we'll learn 3-D Map Feature in Microsoft's new Excel 2016 used to create 3D geospatial visualizations.
3-D Map integrates with Power Pivot data models created in Excel, and leverages the Bing Maps service for visualization and geolocation.
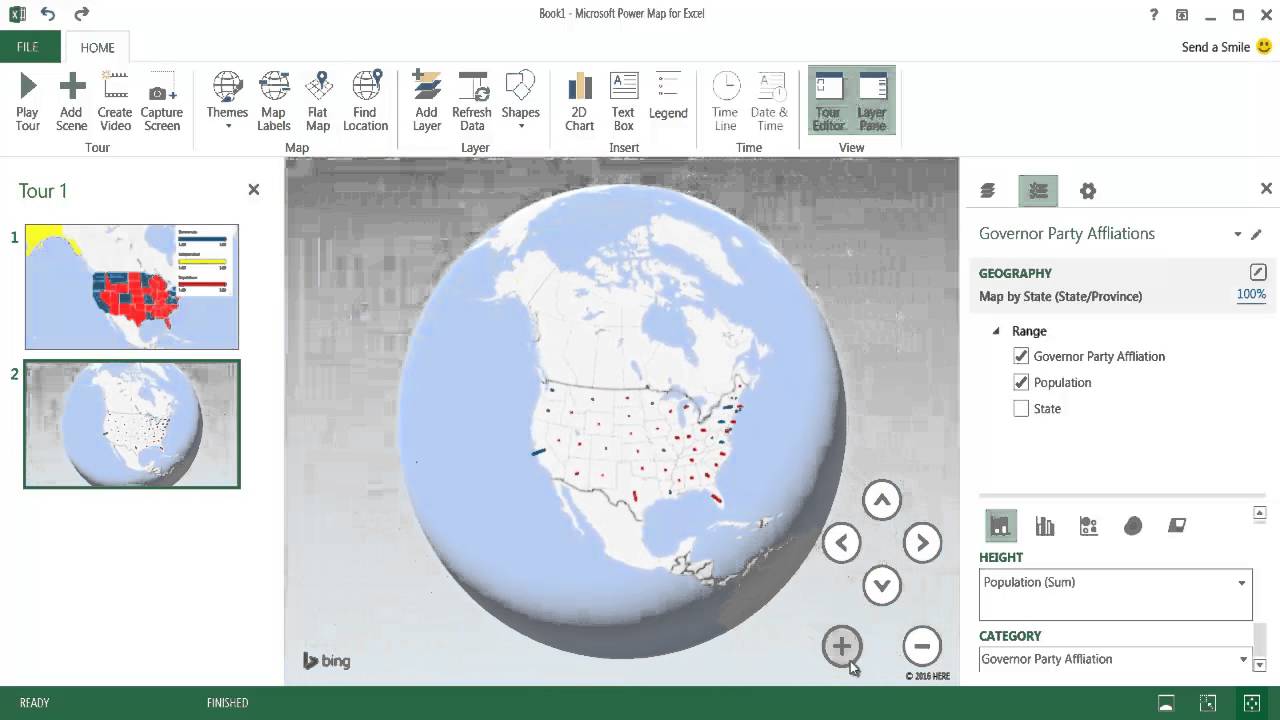
In this video we'll create layers of data on a 3D mapping surface. By combining several layers into a single, interactive visualization, our visualizations help lead to insights not possible using conventional visualizations.
In the next video lesson, we'll take this visualization to the next level by adding an animated "tour" that walks information consumers through the story our data is telling.
Повторяем попытку...

Доступные форматы для скачивания:
Скачать видео
-
Информация по загрузке: