Point and Figure charts
Автор: Trading Tips
Загружено: 2012-08-10
Просмотров: 61464
Описание:
More Trading Tips for Stock Traders at: http://www.TradingTips.com
If you're not already familiar with Point and Figure charts,
then prepare to have your mind blown: These charts don't
look or act like any you've ever seen... But they work!
The big difference between Point-and-Figure charts and
regular candlestick charts is that P&F charts don't use time
as a factor. Some days, you'll get an X or an O on your
chart, other days are ignored. Why? Watch the video and find
out!
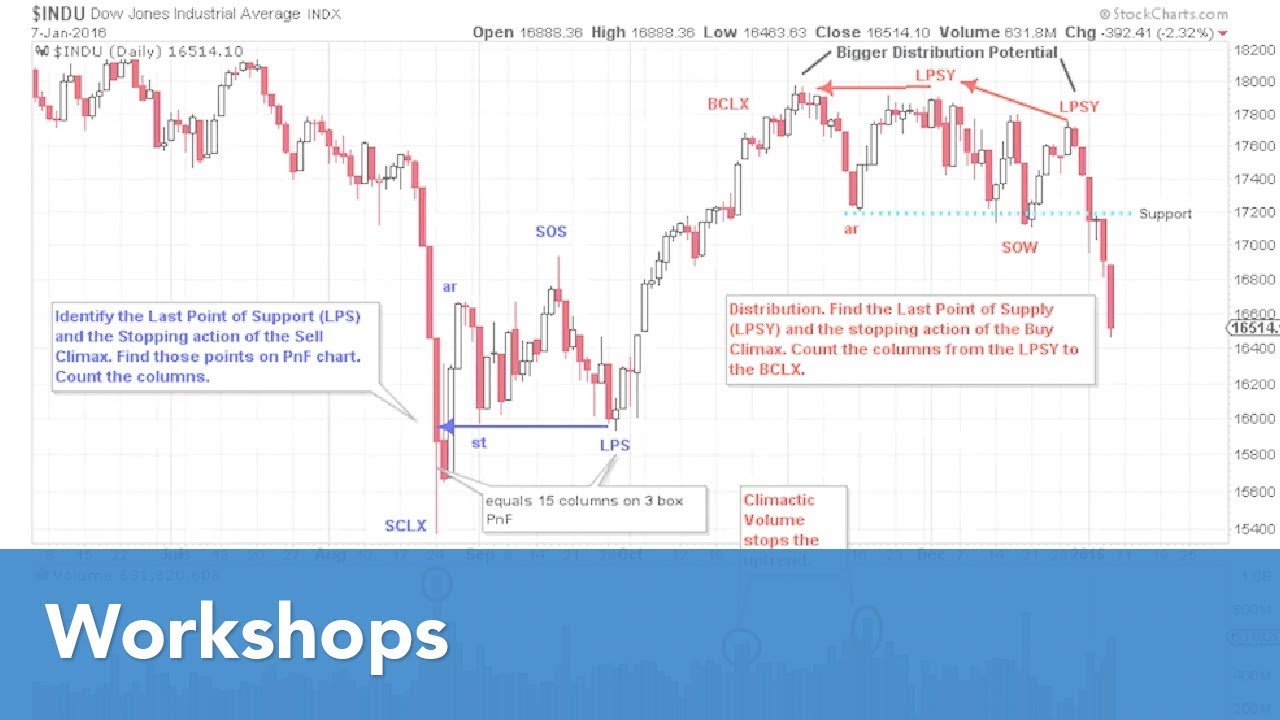
Point and figure charts are highly predictive. You can use
them to find support, resistance, and trend lines that are
just invisible on regular candlestick charts -- and what's
more, they don't give you the false signals that normal
charts do. Think this is too good to be true? Well, watch
and learn!
In this episode, you'll learn:
-How to construct a Point and Figure chart on your own.
-How to read a Point and Figure chart -- what do those X's
and O's mean, anyway?
-How to interpret a P&F chart once you've made it.
-The two main styles of P&F charts -- close and high/low --
and how to use both styles.
Happy Trading!
Повторяем попытку...

Доступные форматы для скачивания:
Скачать видео
-
Информация по загрузке: