Sales data analysis NSDA JOb-1 -Task 1 - part 1 solution Bangla
Автор: BH Graphicx
Загружено: 2026-02-20
Просмотров: 77
Описание:
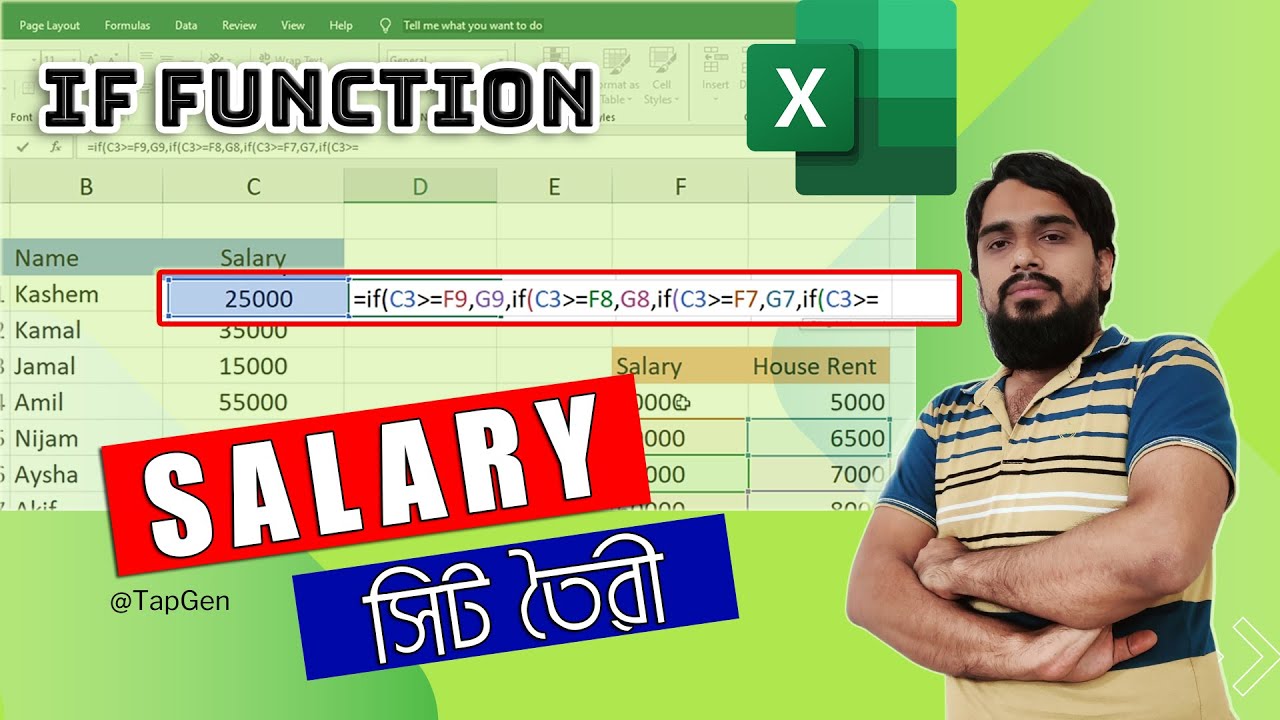
In this video, I have solved the Graphic Design Level-3 (MS Office) Job Sheet step by step.
This task is based on Sales Data Analysis using Spreadsheet (Excel) where I have explained:
✔ How to create a proper sales report
✔ Applying correct font and formatting
✔ Using formulas to calculate Total Sales
✔ Calculating Total Quantity Sold and Total Sales Amount
✔ Applying Conditional Formatting (Highlight sales below TK.20,000)
✔ Inserting a suitable Bar Chart (Clustered Bar)
This video will help students who are preparing for NSDA / Level-3 Graphic Design Assessment.
Watch the full video and practice step by step.
If this video helps you, don’t forget to Like, Comment & Subscribe ❤️
Повторяем попытку...

Доступные форматы для скачивания:
Скачать видео
-
Информация по загрузке: