How to add an Inset in DataGraph
Автор: DataGraph for macOS
Загружено: 2025-10-22
Просмотров: 115
Описание:
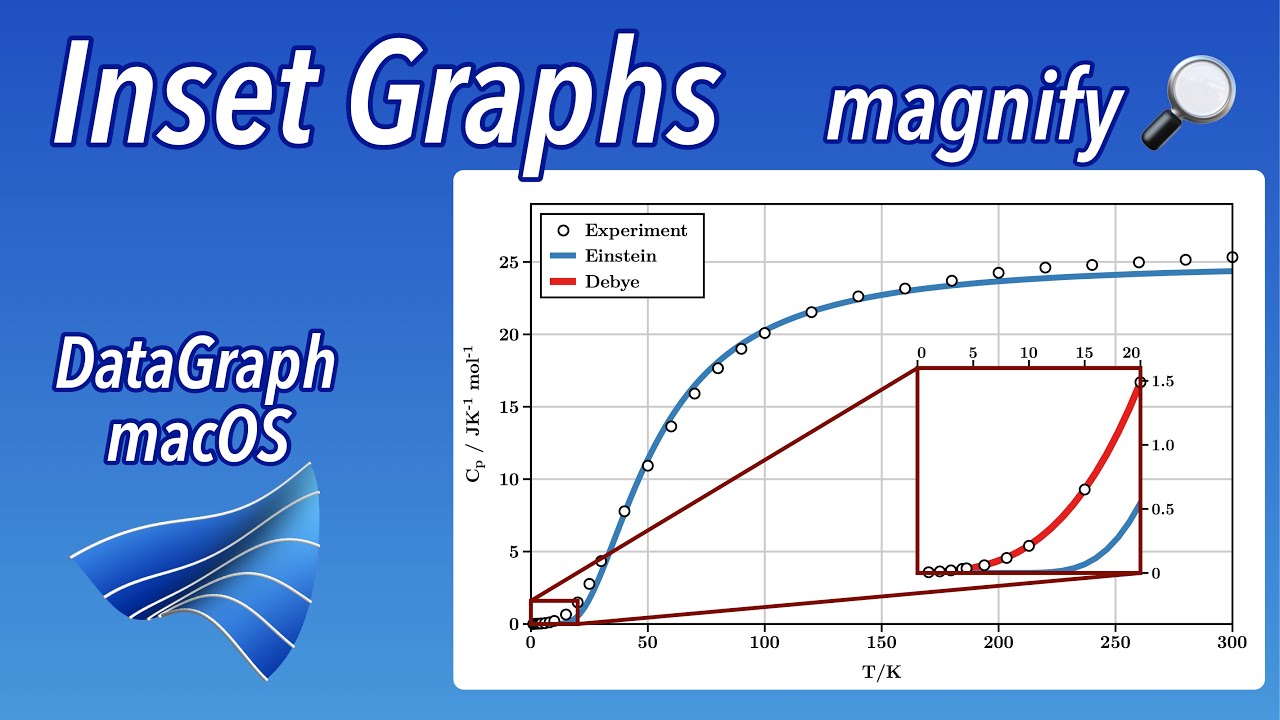
See how easy it is to add an inset to your graph to zoom in on a region of your data using DataGraph.
In this example, we're plotting an experimental data set for heat capacity with temperature compared to different models.
Source: https://scipython.com/blog/inset-plot...
You'll learn how to:
Use the Magnification command to add an inset
Interactively adjust the inset or type exact locations
Pro tip:
Use the inset options to control what is shown in the main graph and/or the inset
More on the Magnification command in DataGraph:
https://community.visualdatatools.com...
DataGraph is a visual data analysis application for Mac that makes it easy to create publication-quality graphs and perform data analysis.
Available on the Mac App Store or at:
https://www.visualdatatools.com/DataG...
Повторяем попытку...
Доступные форматы для скачивания:
Скачать видео
-
Информация по загрузке: