Waiting to Buy Stocks on a Dip? Here’s the S&P 500 Chart Level to Watch
Автор: Barchart
Загружено: 2025-08-19
Просмотров: 1664
Описание:
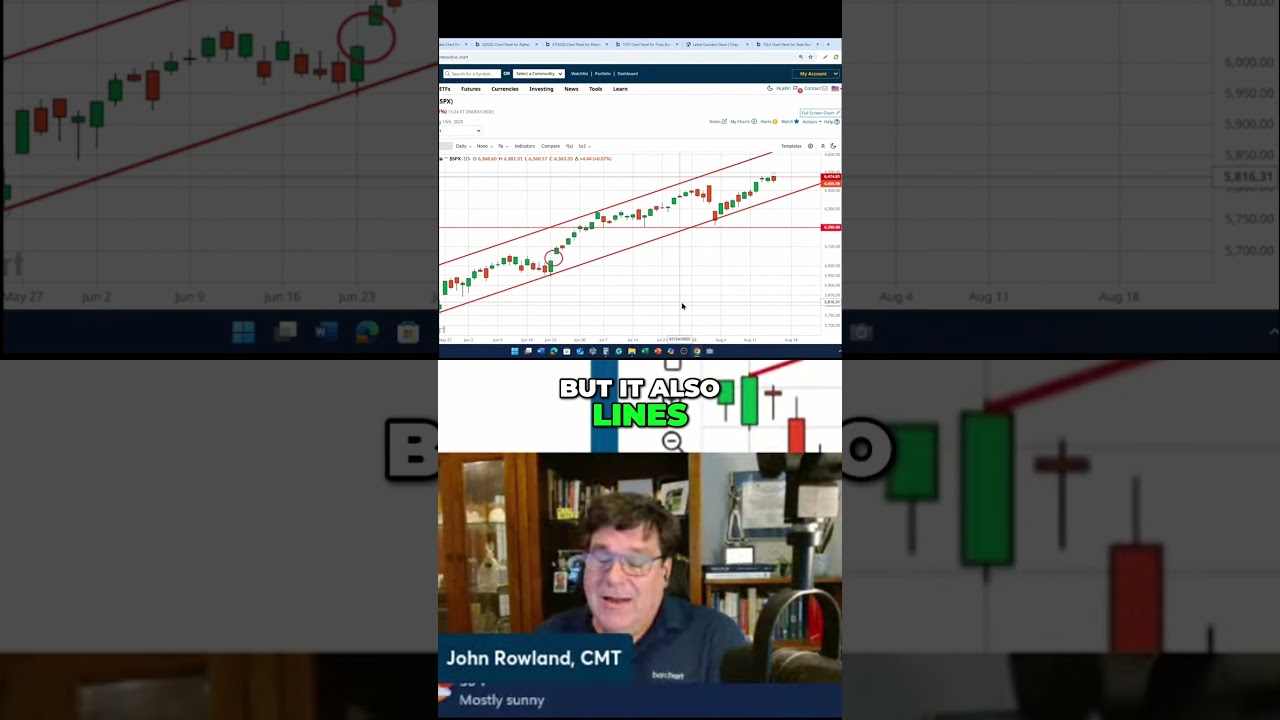
The S&P 500 ($SPX) ($SPY) is sitting at all-time highs, but that doesn’t mean traders should be blindly buying at these levels. Instead, John Rowland, CMT, suggests keeping an eye on gaps — one of the most powerful trading tools for identifying future support and resistance zones.
In the current setup, the S&P 500 is still trading within its upward channel, but John points out that if the index breaks the channel and slips below 6,200, a key psychological and technical level, traders should be prepared for a deeper correction.
In particular, John highlights the same gap that kicked off this most recent rally. That zone sits between $6,028 and $6,059 on the S&P 500. If the S&P 500 revisits that level, it would represent about an 8–8.5% pullback from current prices.
This would classify as a minor correction, but one that could offer a much better entry point than chasing all-time highs. Watch the clip, and learn more about how to trade gaps at Barchart: https://www.barchart.com/story/news/3...
Повторяем попытку...
Доступные форматы для скачивания:
Скачать видео
-
Информация по загрузке:


