Step-by-Step Power BI Sales Teams Dashboard | Time-Lapse video
Автор: Kate Dashboards
Загружено: 2025-04-26
Просмотров: 1162
Описание:
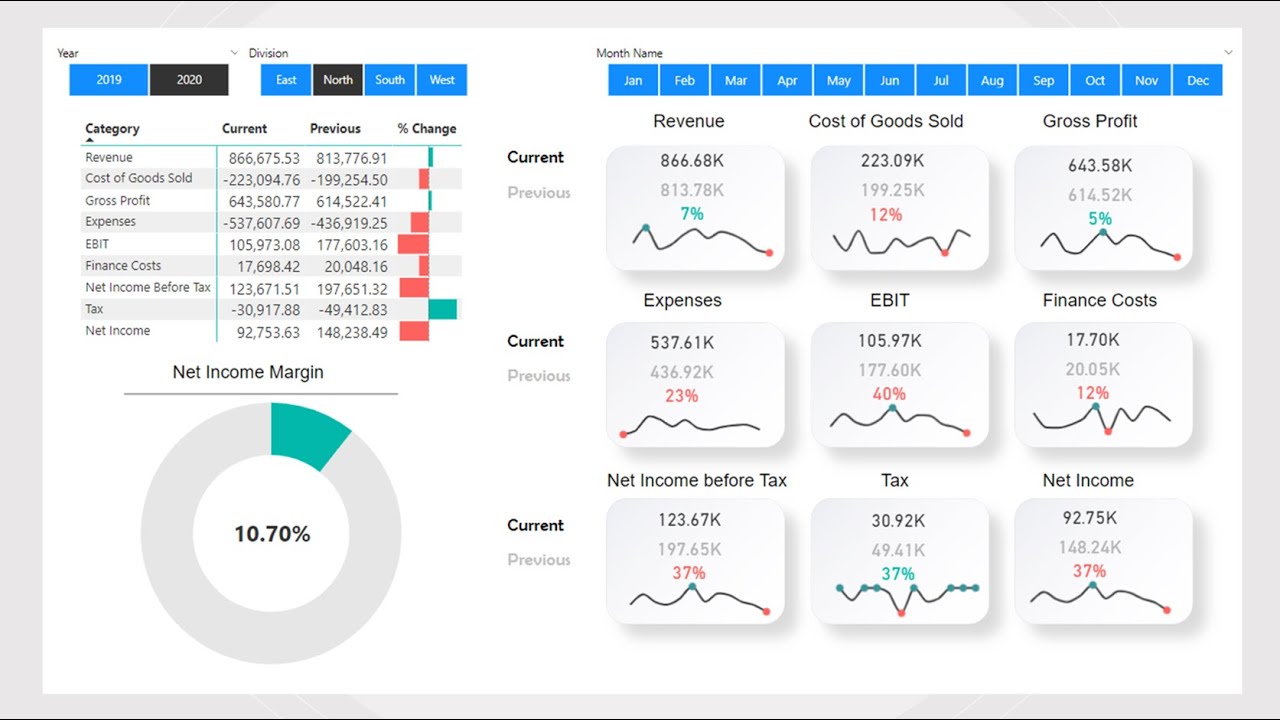
"Behind the Scenes" series: This time-lapse video showcases the step-by-step process of transforming Excel sales data into an interactive Power BI Sales Teams Dashboard. The dashboard dynamically adjusts based on selections, providing insights into sales performance, team analytics, and key metrics.
The Power BI template and sample data are available for download in the link below, allowing you to recreate the dashboard from scratch.
This dashboard is also featured in a separate video with a detailed walkthrough of its functionality. Watch it here:
• Visualising Sales Team Performance - Inter...
Resources:
Download BI Dashboard Template and Excel Data Files
https://drive.google.com/drive/folder...
Timestamp:
00:00 Intro
00:27 Import Data from Excel
03:26 Insert Slicer for Fiscal Year
04:10 Create Measure Table
04:44 Add New Parameter for Benchmark
06:57 Add Parameter for Button Slicer
08:26 Insert First Visual Card
12:15 Insert Line and Clustered Column Chart
14:37 Insert Map Visual
15:33 Insert Line Chart
17.12 Insert Clustered Bar Chart
22:46 Edit Chart Interaction
/ @katedashboards
Thanks for watching!
#powerbi #dashboard #template #kpi #exceltopowerbi #salesteamsdashboard #datavisualisation #businessintelligence #businessreview #freedownload #lipstickchart #sales #fiscalyear
Повторяем попытку...

Доступные форматы для скачивания:
Скачать видео
-
Информация по загрузке:


![1 A.M Study Session 📚 [lofi hip hop]](https://imager.clipsaver.ru/lTRiuFIWV54/max.jpg)