Falling Wedge Breakout 🚀 | XAUUSD 5M Chart | Gold Price Action Live 📈💰
Автор: Secret Trader
Загружено: 2025-08-15
Просмотров: 1328
Описание:
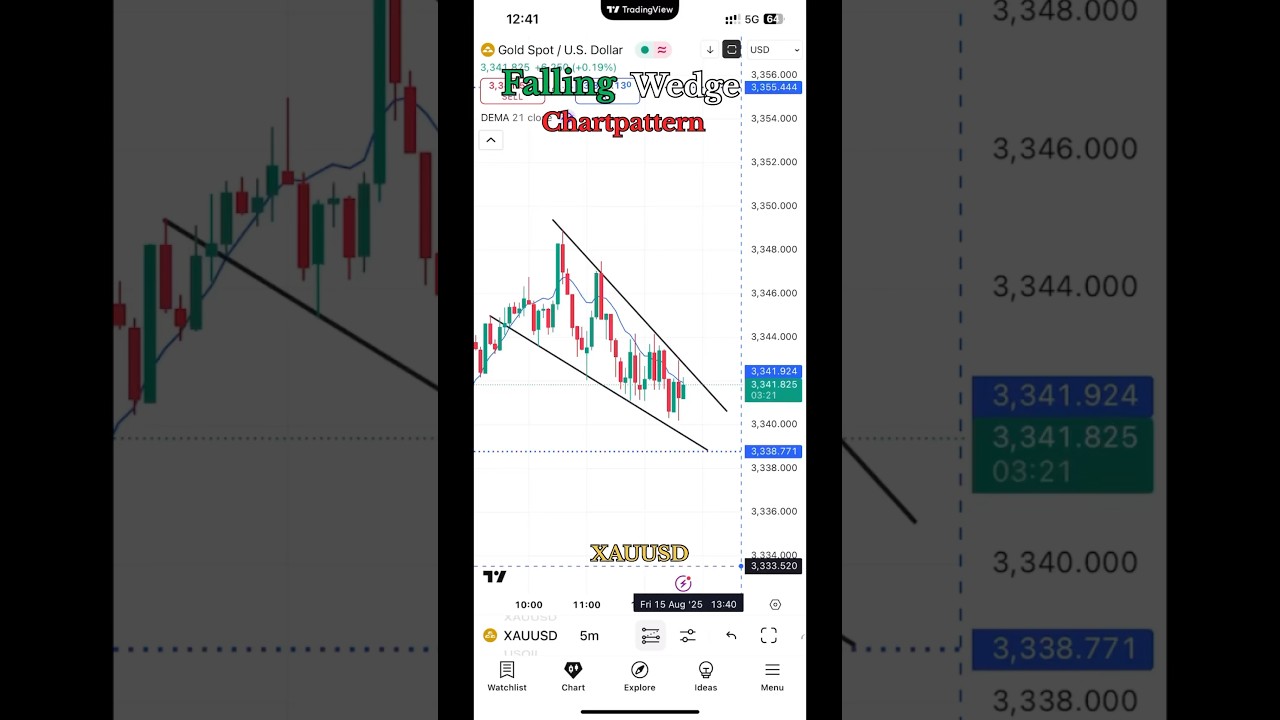
On 15 August 2025, XAUUSD (Gold) formed a classic Falling Wedge pattern on the 5-minute chart. 📉
This pattern is a strong bullish reversal signal, showing that sellers are losing momentum and buyers are preparing for a breakout. 💹
In this setup, price kept making lower highs and lower lows inside two converging trendlines. Once the upper trendline was broken with strong bullish candles, we entered a breakout trade. 📈
The result? A powerful move upward, hitting targets quickly and confirming the price action setup. 🚀
This is a perfect example of how technical analysis and patience can pay off in trading. Whether you’re a beginner or experienced trader, recognizing chart patterns like the Falling Wedge can boost your trading success.
✅ Pair: XAUUSD / Gold Spot
✅ Timeframe: 5-Minute Chart
✅ Pattern: Falling Wedge (Bullish Breakout)
✅ Date: 15 August 2025
💬 Share your thoughts below if you’ve traded this pattern before!
Повторяем попытку...
Доступные форматы для скачивания:
Скачать видео
-
Информация по загрузке: