💡𝗣𝗼𝘄𝗲𝗿 𝗕𝗜 𝗧𝘂𝘁𝗼𝗿𝗶𝗮𝗹: 𝗖𝗼𝗺𝗯𝗶𝗻𝗲 𝗠𝘂𝗹𝘁𝗶𝗽𝗹𝗲 𝗘𝘅𝗰𝗲𝗹 𝗦𝗵𝗲𝗲𝘁𝘀 & 𝗖𝗹𝗲𝗮𝗻𝗶𝗻𝗴 𝗠𝗲𝘀𝘀𝘆 𝗘𝘅𝗰𝗲𝗹 𝗗𝗮𝘁𝗮 💡
Автор: Learn with Elen 📖📚
Загружено: 2026-01-01
Просмотров: 85
Описание:
Hello and a very good day everyone,
In this #post, I shared a 14 #minutes video on #PowerBI.
In this 14-minute Power BI #tutorial, I explained on :
1. Import data from Excel to Power BI
2. Combine several worksheet into one database
3. Perform data cleaning in #PowerQuery
4. Building another dummy table
5. Change data source
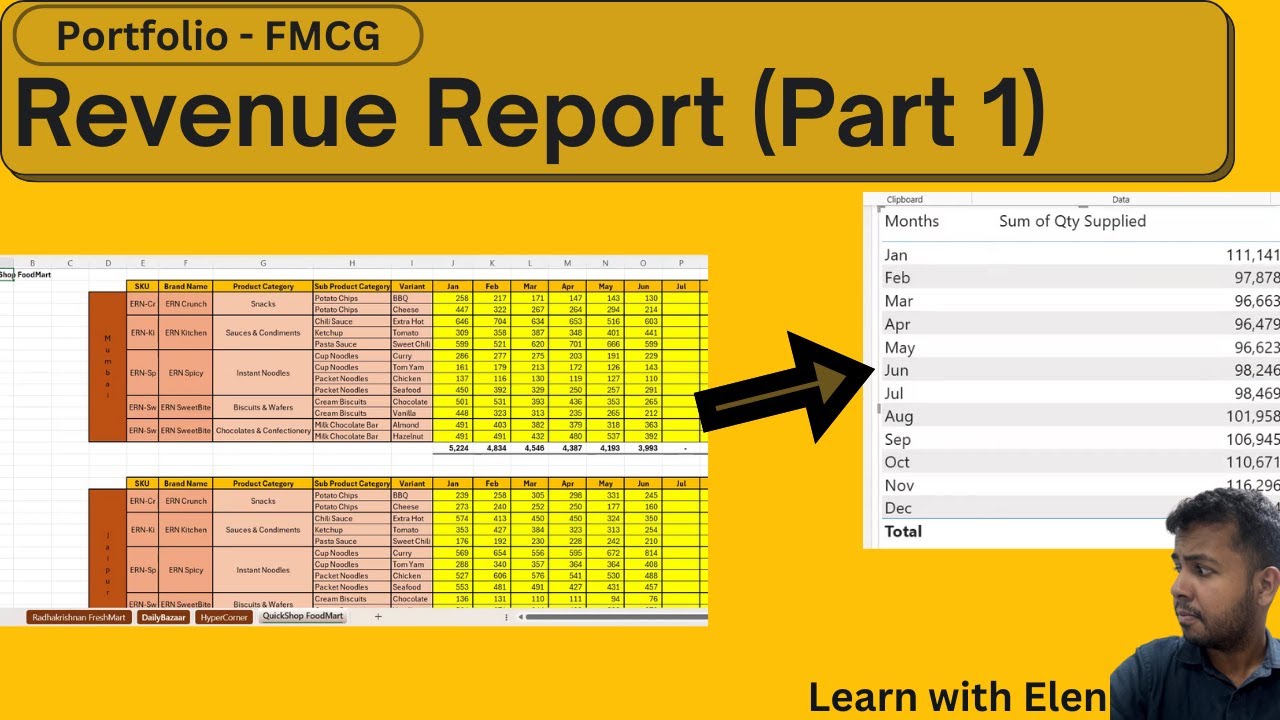
📊 𝗕𝗮𝘀𝗶𝗰𝗮𝗹𝗹𝘆, 𝘁𝗵𝗲 𝗱𝗮𝘁𝗮𝘀𝗲𝘁 𝗵𝗮𝘀
• Monthly quantity supplied
• FMCG goods
• 4 different retailers (each in separate #worksheets)
• Multiple locations
• Data stored in 4 separate Excel worksheets (one per retailer)
• Data is not structured like a proper database
🕒 𝗩𝗶𝗱𝗲𝗼 𝗧𝗶𝗺𝗲𝗹𝗶𝗻𝗲
01:32 – Import Excel data into Power BI
02:35 – Open Power Query (Transform Data) for data cleaning
03:00 – Combine 4 worksheets by removing Change Type, Promoted Headers & Navigation to return to source
03:30 – Data cleaning steps:
• Remove unnecessary columns
• Fill down
• Remove and filter rows
• Unpivot columns
10:02 – Load cleaned data and create visuals
⚠️ 𝗜𝘀𝘀𝘂𝗲 𝗳𝗮𝗰𝗲𝗱: Monthly data (Jan, Feb, Mar…) stored as text, causing Power BI to sort alphabetically (Apr → Aug → Feb…)
𝗦𝗼𝗹𝘂𝘁𝗶𝗼𝗻: Go back to Power Query and create a dummy month table to fix the sorting issue properly.
13:18 – Change data source via Data Source Settings
➡️ Example: Switch from June file to December file
➡️ Enables future automation without redoing Power Query steps or visuals
📁 𝗧𝗼 𝗿𝗲𝗳𝗲𝗿 𝘁𝗵𝗲 𝗳𝗶𝗹𝗲 𝗺𝗮𝘁𝗲𝗿𝗶𝗮𝗹, 𝗸𝗶𝗻𝗱𝗹𝘆 𝗿𝗲𝗳𝗲𝗿 𝘁𝗼 𝘁𝗵𝗲 𝗹𝗶𝗻𝗸 𝘀𝗵𝗮𝗿𝗲𝗱 𝗯𝗲𝗹𝗼𝘄 :
https://cadtrainingcentre760-my.share...
⚠️ 𝗗𝗶𝘀𝗰𝗹𝗮𝗶𝗺𝗲𝗿
𝗧𝗵𝗶𝘀 𝗶𝘀 𝗳𝗶𝗰𝘁𝗶𝗼𝗻𝗮𝗹 𝗱𝗮𝘁𝗮 𝗰𝗿𝗲𝗮𝘁𝗲𝗱 𝗽𝘂𝗿𝗲𝗹𝘆 𝗳𝗼𝗿 𝗲𝗱𝘂𝗰𝗮𝘁𝗶𝗼𝗻𝗮𝗹 𝗽𝘂𝗿𝗽𝗼𝘀𝗲𝘀.
𝗧𝗵𝗲 𝗳𝗶𝗴𝘂𝗿𝗲𝘀 𝗽𝗿𝗲𝘀𝗲𝗻𝘁𝗲𝗱 𝗱𝗼 𝗻𝗼𝘁 𝗿𝗲𝗽𝗿𝗲𝘀𝗲𝗻𝘁 𝗿𝗲𝗮𝗹 𝗯𝗮𝗻𝗸𝗶𝗻𝗴 𝗱𝗮𝘁𝗮.
Feel #free to #watch the video.
Should you #have any #questions, feel #free to #ask in the #comments section
Повторяем попытку...
Доступные форматы для скачивания:
Скачать видео
-
Информация по загрузке:


