Скачать
Excel table graph showing product rating using stars and half stars
Автор: Ron Lembke
Загружено: 2026-02-20
Просмотров: 30
Описание:
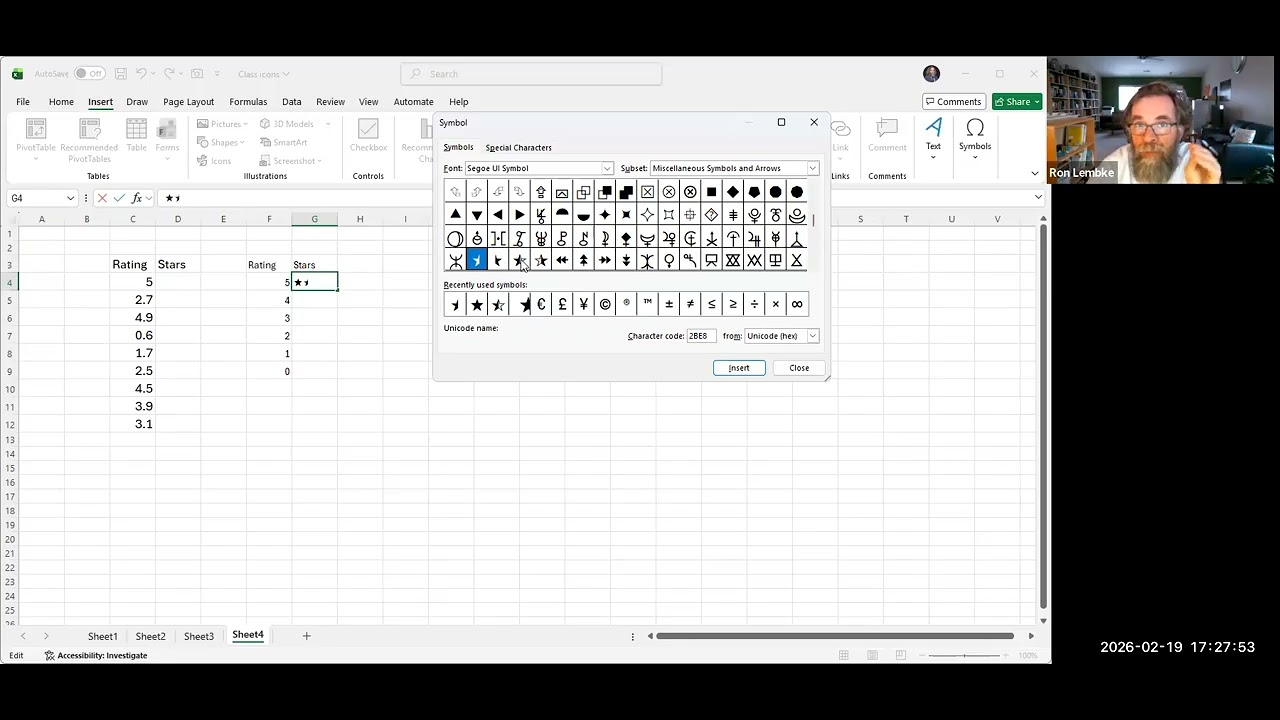
In this previous video, we made a table that uses the number in column 1 to put a corresponding number of (whole) stars in column 2.
• Excel table graphs using multiple stars
In this video, we do the same thing, but we include half stars.
We show which font to use to get half-stars and insert them into the spreadsheet.
We have a table that shows how many stars should be used for a given rating, and use the XLOOKUP() function to put the proper number of stars into column 2, based on the values in column 1.
Не удается загрузить Youtube-плеер. Проверьте блокировку Youtube в вашей сети.
Повторяем попытку...
Повторяем попытку...
Доступные форматы для скачивания:
Скачать видео
-
Информация по загрузке: