Indian Market Key Statistics | DII–FPI Flows, 52-Week High/Low, A/D Ratio & Sector Breadth | 01 DEC
Автор: Indian Market Matters
Загружено: 2025-12-01
Просмотров: 13
Описание:
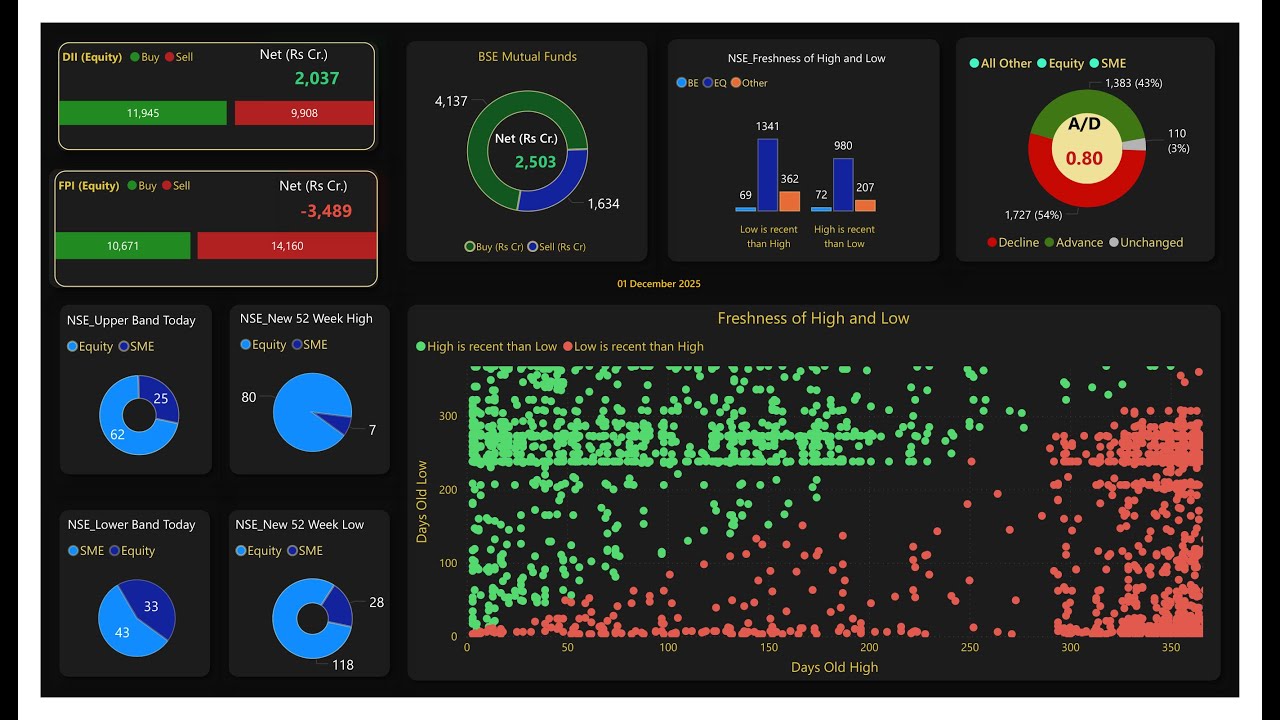
In this video, we break down the complete Market Breadth & Liquidity Dashboard for 01 December 2025, covering key metrics that reveal the underlying strength and sentiment of the Indian stock market.
📌 What This Dashboard Shows
1. DII & FPI Cash Market Activity (Equity)
Side-by-side Buy vs Sell comparison gives a clear liquidity picture.
2. BSE Mutual Funds Flow
Shows domestic long-term investor participation.
3. NSE Advance–Decline Ratio
A very balanced market breadth with slight negative tilt.
4. Freshness of 52-Week High & 52-Week Low
Stocks where High is more recent
Stocks where Low is more recent
Separate counts for EQ / BE / Other categories.
5. Upper & Lower Circuit Hits (NSE)
6. New 52-Week Highs & Lows
7. Scatter Plot — Freshness of High & Low
A powerful visual showing:
Green: High is more recent
Red: Low is more recent
Distribution based on Days Old High vs Days Old Low, revealing momentum pockets and weakness clusters.
This is one of the most comprehensive single-frame overviews of market sentiment and technical health.
If you find the visual insights helpful, do Like, Share & Subscribe!
#NSE #DII #FPI #MarketBreadth #52WeekHigh #52WeekLow #AdvanceDecline #IndianStockMarket #StockMarketIndia #TradingInsights #MomentumStocks #FNO #Nifty #Sensex #TechnicalAnalysis #MarketUpdate #EquityMarket #InvestingIndia
Повторяем попытку...
Доступные форматы для скачивания:
Скачать видео
-
Информация по загрузке: