Power BI Trick: Highlight the Selected Period in a Line Chart
Автор: Abdelytics
Загружено: 2026-03-08
Просмотров: 135
Описание:
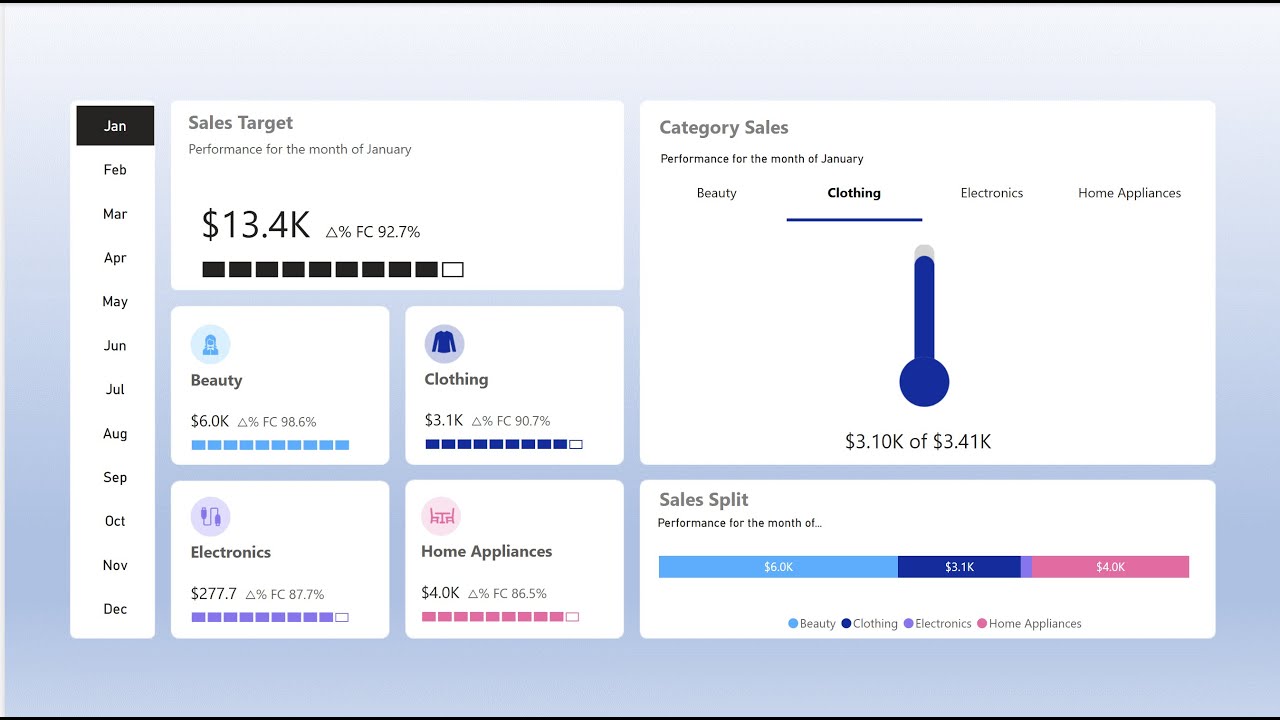
In this quick Power BI tutorial, I show you a simple technique to highlight the selected period in a line chart using a date slicer.
When users select a date range, it can sometimes be difficult to visually identify the exact portion of the trend they are analyzing. In this video, you'll learn how to highlight the selected window so the relevant period stands out immediately.
In this tutorial you'll learn how to:
• Create a line chart using End-of-Month dates
• Capture the selected period using DAX
• Add reference lines for the start and end dates
• Use a visual calculation to highlight the selected range
• Add dynamic insights for the selected period premium
This technique improves trend analysis and user experience in Power BI dashboards.
get the files here: https://drive.google.com/drive/folder...
If you enjoy practical Power BI tips and dashboard techniques, consider subscribing to the channel.
Повторяем попытку...

Доступные форматы для скачивания:
Скачать видео
-
Информация по загрузке: