Скачать
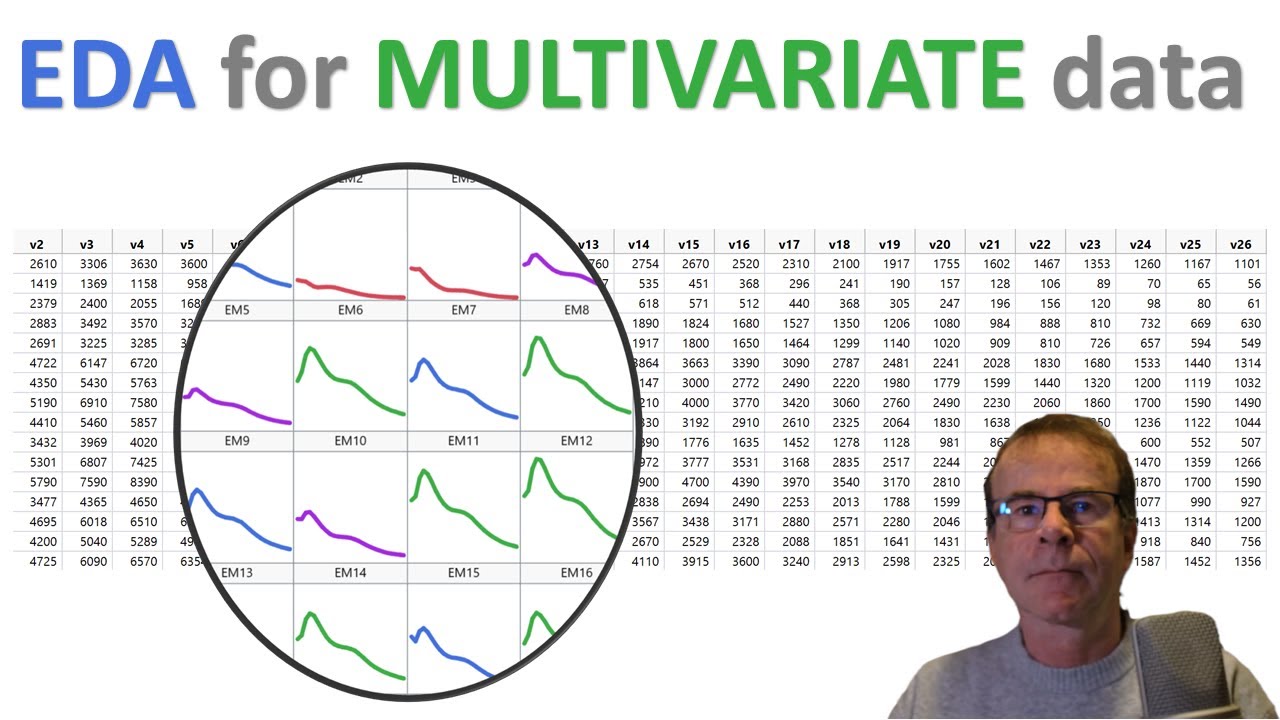
Exploratory data analysis of (functional) multivariate data using JMP
Автор: PegaAnalytics
Загружено: 2024-02-01
Просмотров: 1220
Описание: Some forms of multivariate data are best visualised as a curve. This involves transforming the shape of the data to reveal its functional form. This visualisation can be further enhanced by grouping similar shape curves together - this can be done by performing cluster analysis on the original multivariate structure. Describing this process is much harder than just doing it inside JMP Software! So I will explain it, and show it, and also show how JMP's workflow object can aid the process.
Не удается загрузить Youtube-плеер. Проверьте блокировку Youtube в вашей сети.
Повторяем попытку...
Повторяем попытку...
Доступные форматы для скачивания:
Скачать видео
-
Информация по загрузке: