Скачать
Svelte Data Visualization Tutorial | Animated Graphics Using SVG + D3.js + Svelte Transitions
Автор: Phillip Rubin
Загружено: 2024-04-22
Просмотров: 1818
Описание:
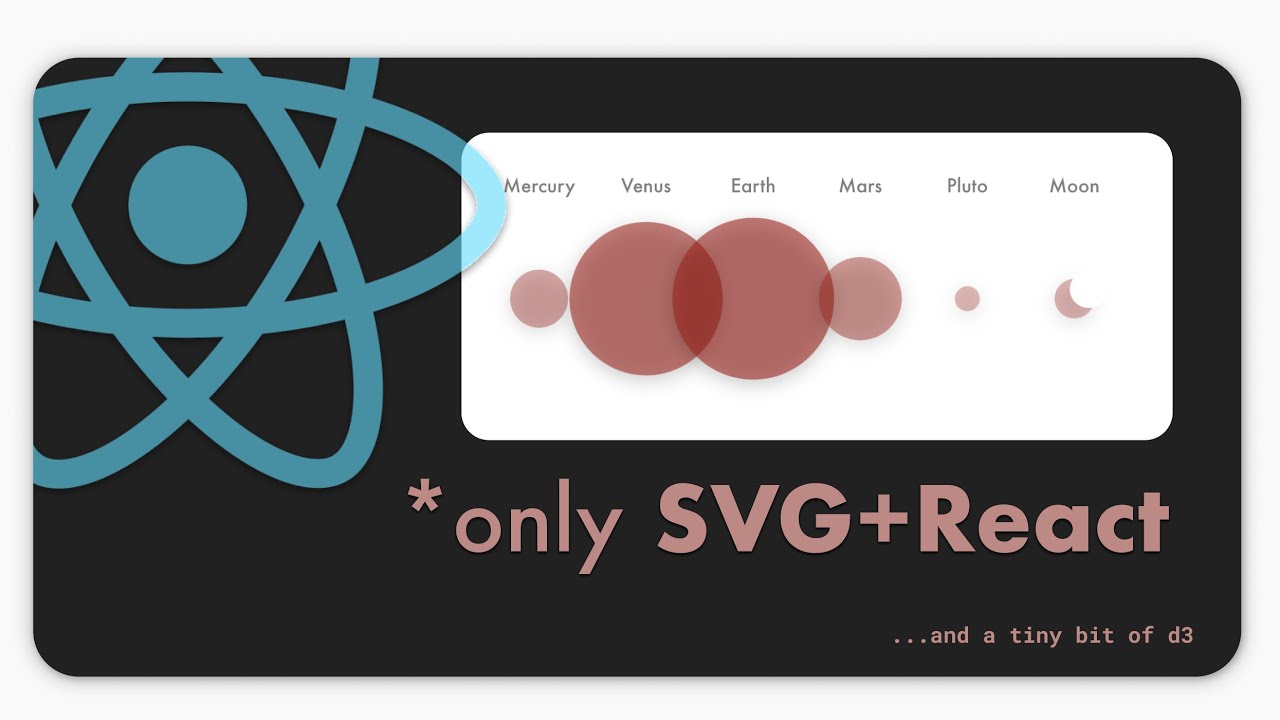
Leverage some magical properties of Svelte to build this animated bouquet chart using Svelte Transitions, CSS, SVG and D3.js
My code along with some mock data can be found here:
https://svelte.dev/repl/ec562b8781474...
This is fairly adaptable to React, Vue, or your framework of choice. If you would like to see an example in React or anything else, feel free to leave a comment below.
Не удается загрузить Youtube-плеер. Проверьте блокировку Youtube в вашей сети.
Повторяем попытку...
Повторяем попытку...

Доступные форматы для скачивания:
Скачать видео
-
Информация по загрузке: