Скачать
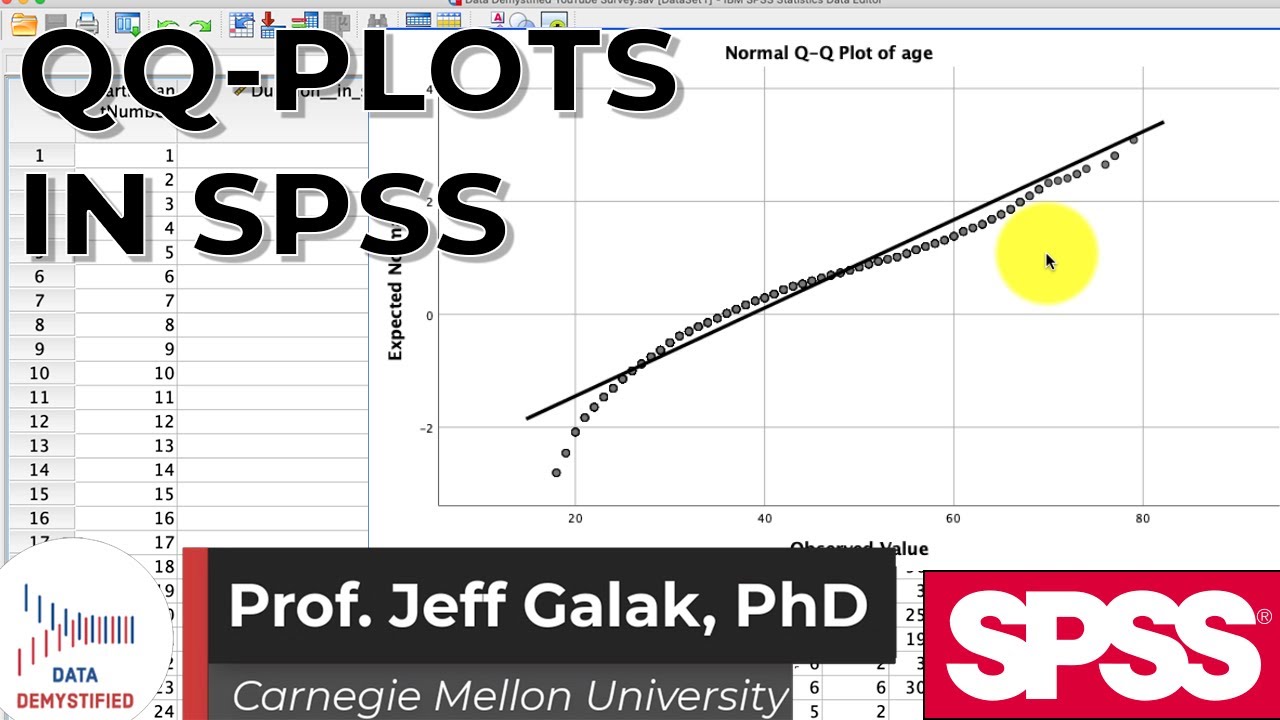
Creating and Interpreting Normal Q-Q Plots in SPSS
Автор: Dr. Todd Grande
Загружено: 2015-10-17
Просмотров: 74231
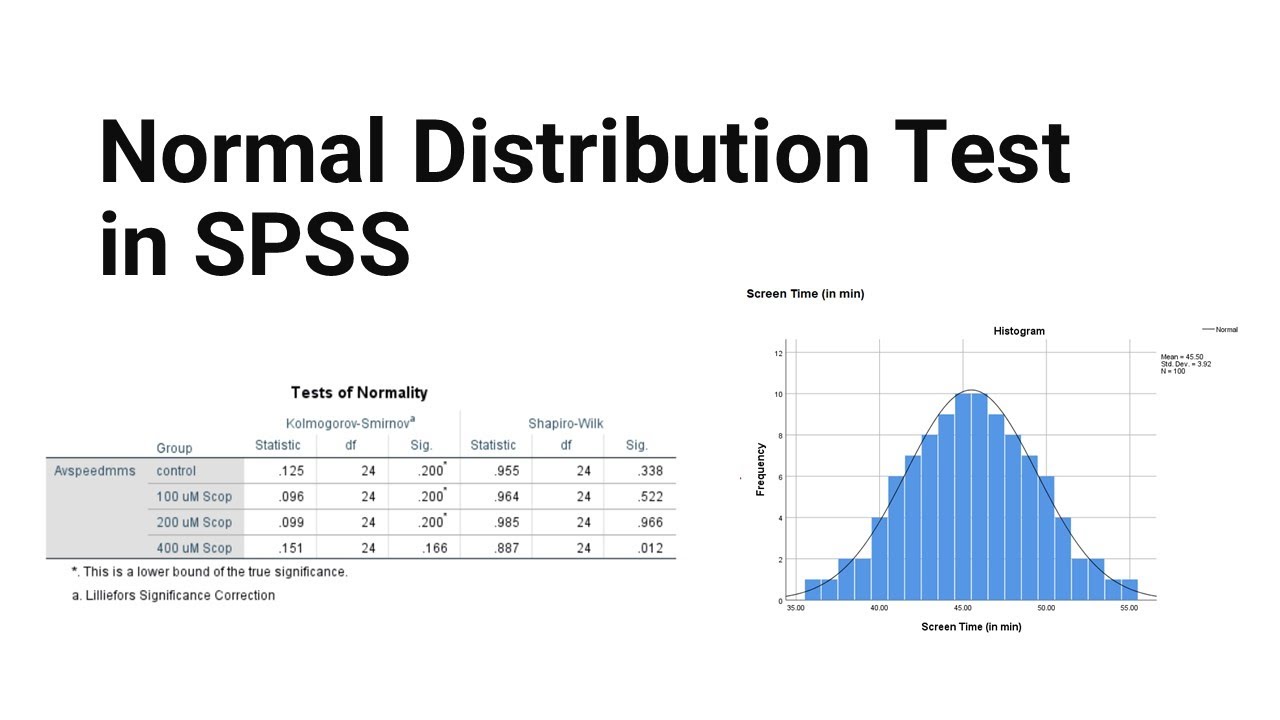
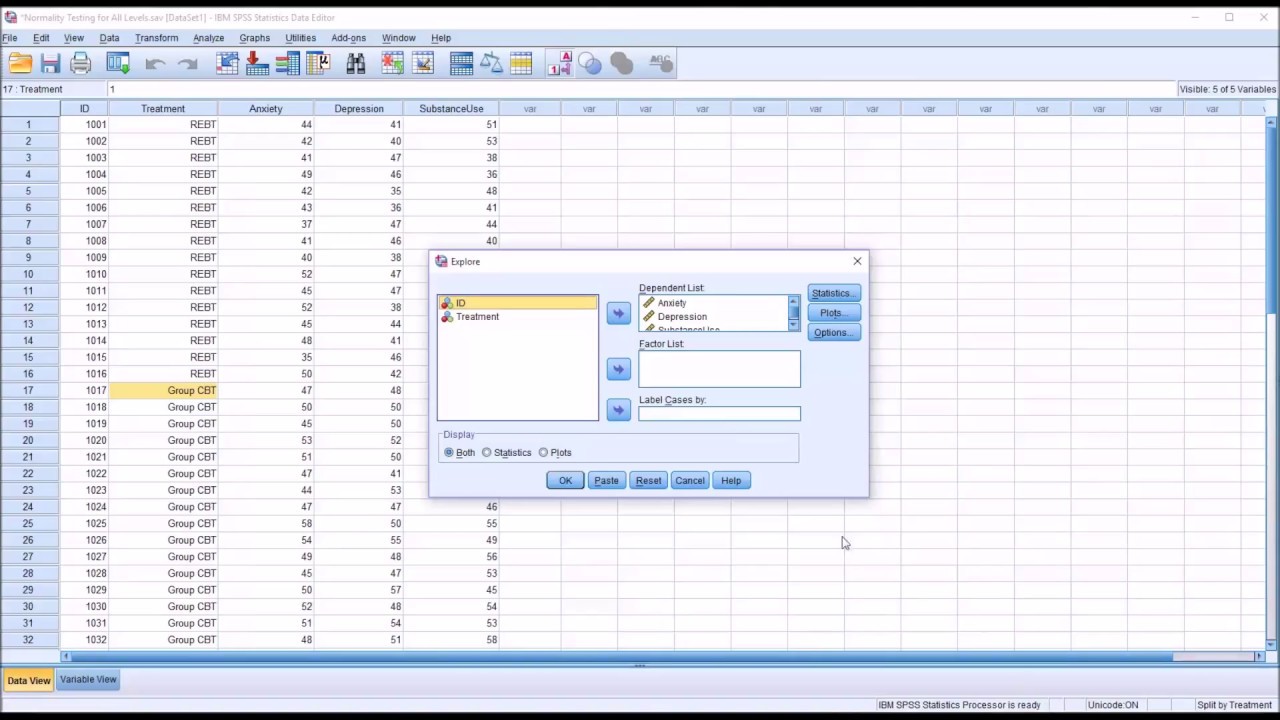
Описание: This video demonstrates how to create and interpret a normal Q-Q plot (quantile-quantile plot) in SPSS. A normal Q-Q Plot is used to determine how well a variable fits the normal distribution.
Не удается загрузить Youtube-плеер. Проверьте блокировку Youtube в вашей сети.
Повторяем попытку...
Повторяем попытку...

Доступные форматы для скачивания:
Скачать видео
-
Информация по загрузке: