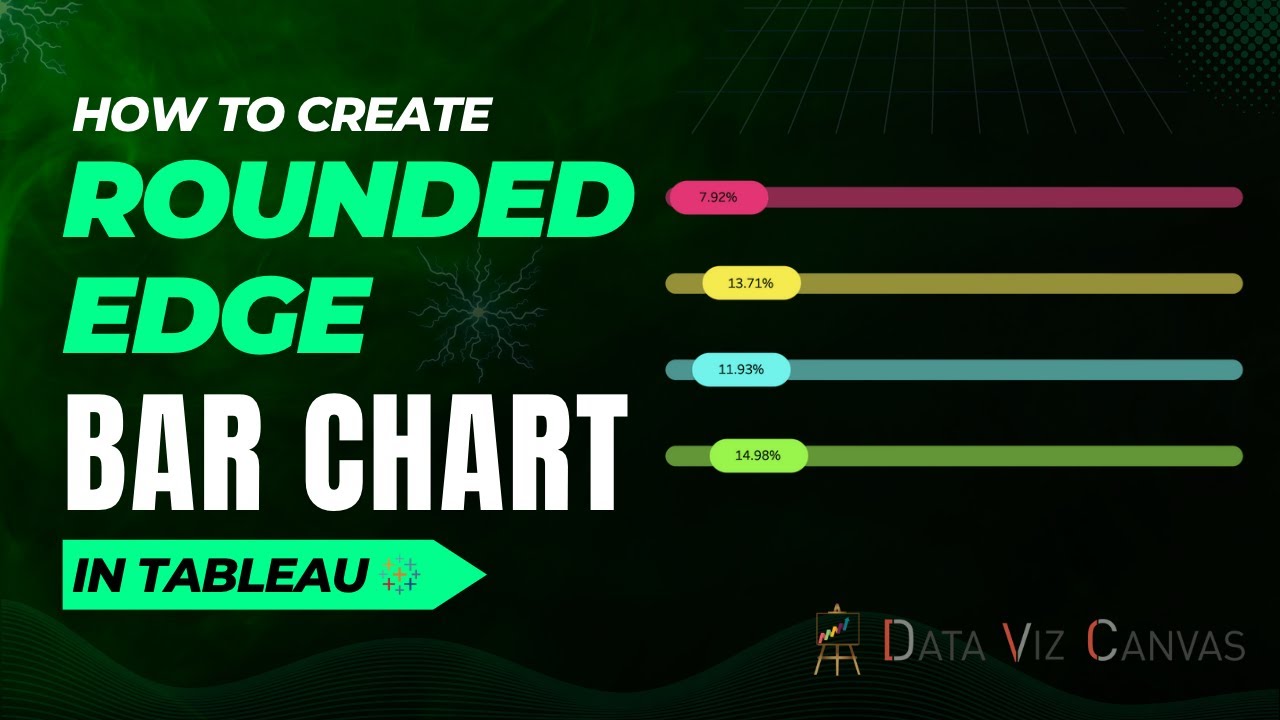
Rounded edge bar chart in tableau
Автор: Data Viz Canvas
Загружено: 2023-02-17
Просмотров: 9334
Описание:
A rounded bar chart is a unique chart type that represent data in a more visually appealing way. In a rounded bar chart, the bars have rounded edges instead of sharp corners, which can make the chart look more modern and professional but at the same time it may be less effective at showing precise values than a traditional bar chart with sharp corners.
--------------------------------------------
📚 Recommended Books
--------------------------------------------
📚 DATA VISUALISATION & STORYTELLING
Storytelling with Data: A Data Visualisation Guide for Business Professionals https://amzn.to/3q9ygPw
Data Visualisation: A Handbook for Data Driven Design https://amzn.to/3qfb1na
The Big Book of Dashboards https://amzn.to/3q4i3eG
Data Visualization: A Practical Introduction https://amzn.to/44KYrel
Storytelling with Data : Lets Practice https://amzn.to/44O7WcL
Tableau Desktop Specialist Certification: https://amzn.to/44Ocy2P
Tableau Desktop Certified Associate: https://amzn.to/3Kk2YfV
📚 SQL
SQL for Data Analytics: https://amzn.to/3rROkGj
SQL 3 books in 1 : https://amzn.to/3KklUuY
Learning SQL: Generate, Manipulate and Retrieve Data : https://amzn.to/3Kn34mN
SQL Quick Start Guide: https://amzn.to/3KInOpx
📚 DATA ENGINEERING
Data Engineering with Python : https://amzn.to/3YelH1Y
Data Engineering with AWS: https://amzn.to/3YgXoAL
Fundamentals of Data Engineering: https://amzn.to/3OAUVxy
Software Architecture: https://amzn.to/3KmNffX
System Design Interview: https://amzn.to/3Yhfy5q
Ace Data Science Interview: https://amzn.to/3rOxcBl
System Design Interview: https://amzn.to/3OAw8d7
Designing Machine Learning Systems: https://amzn.to/3YbGxiB
📚 SOFTWARE ENGINEERING
Clean Code https://amzn.to/47aBnr4
Clean Architecture https://amzn.to/3OA8VaP
The Programmatic Programmer: https://amzn.to/4793k2C
-----------------------------------------
👇 CHECK THIS OUT! 👇
-----------------------------------------
🏪 AMAZON STOREFRONT
https://www.amazon.com/shop/datavizca...
All my recommendations for books, gadgets and gear are also available at my
Amazon storefront. Check it out!
👕 LIKE THE "DATA RELATED GIFTS" WITH CREATIVE, FUNNY & HUMOROUS QUOTES FOR ANYONE WHO LIKE TO LAUGH ?
You can purchase one here: https://www.datavizcanvas.com/shop/#!/
--------------------------------------------------------------------------------
😍 📧 REACH OUT TO ME ON SOCIAL MEDIA 😍
--------------------------------------------------------------------------------
Instagram: / datavizcanvas
Twitter: / datavizcanvas
Facebook https://www.facebook.com/profile.php?...
Linkedin: / gurpreetsingh515
Tableau public https://public.tableau.com/app/profil...
Website : https://www.datavizcanvas.com/
-------------------
GEAR I USE
-------------------
📷 Video
Canon EOS RP https://amzn.to/3QkOpfU
Canon RF 35mm https://amzn.to/3rNIh5E
Canon RF 14-35mm https://amzn.to/44JQw0Y
🎙️ Audio
Rode NT-USB Versatile Studio https://amzn.to/3DCbxyY
Rode PSA1 Professional Studio Arm https://amzn.to/3ObseWN
⏱ TIMESTAMPS
00:00 - Introduction
02:14 - Connect to data source
03:14 - Show percentage as rounded bar chart
09:18 - Show sales as rounded bar chart
‼️ DISCLAIMERS
Links included in this description may be affiliate links. When you buy a product or service with these links, I may receive a small commission. However, there is no additional cost to you :) I genuinely appreciate you supporting my channel so I can continue to provide you with awesome content for free!
Thanks for being a part of this channel and all your support! 💪 🙏
Повторяем попытку...
Доступные форматы для скачивания:
Скачать видео
-
Информация по загрузке: