Inbox Insights: Decoding Email Campaigns in Tableau with Serena Purslow | Behind the Viz
Автор: Will Sutton
Загружено: 2023-08-23
Просмотров: 436
Описание:
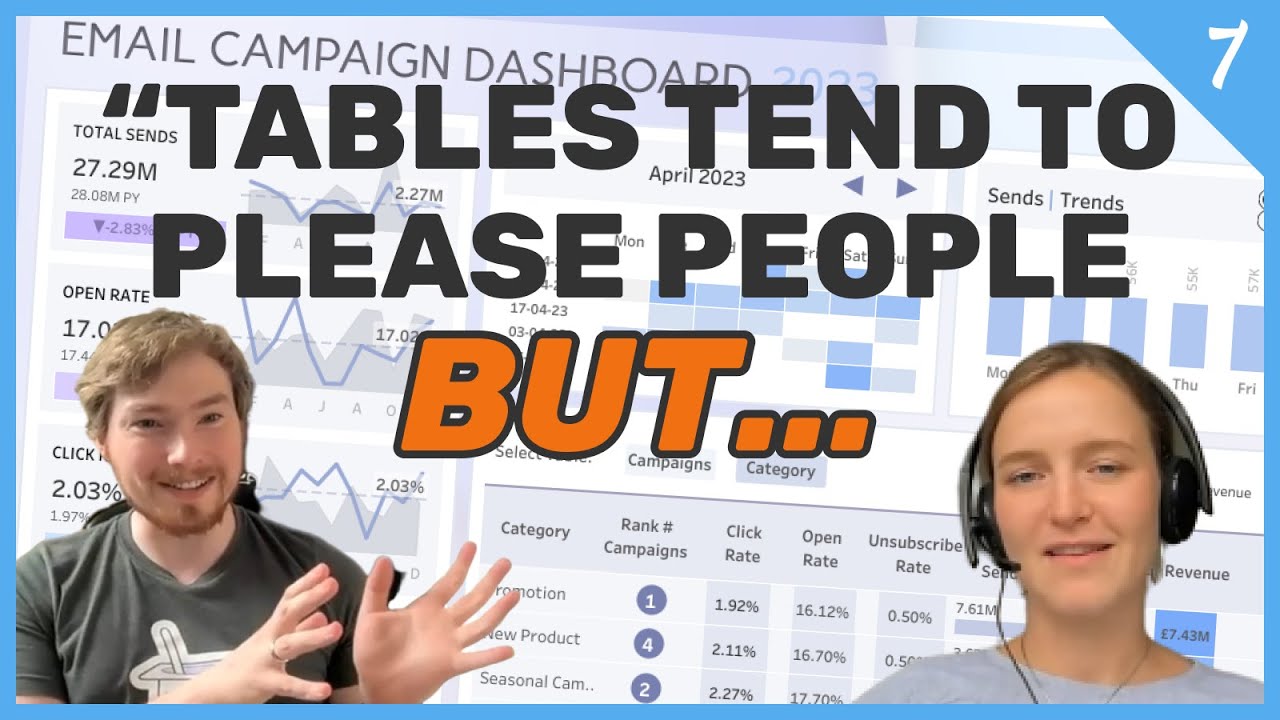
Behind the Viz | Season 1 Episode 7 | Email Campaign Dashboard
Serena Purslow
Twitter: / serenapurslow
LinkedIn: / serena-purslow-8665a61a2
Portfolio: https://public.tableau.com/app/profil...
📈 The visualisation:
https://public.tableau.com/app/profil...
Mentioned in this talk:
First dashboard: https://public.tableau.com/app/profil...
Workout Wednesday Text Tables Challenge:
https://public.tableau.com/app/profil...
Tableau Prep ESG Talk:
https://usergroups.tableau.com/events...
Chapters
00:00 - Intro
00:24 - How do you start your projects?
01:59 - Creating mock data
04:14 - How did you pick your charts?
06:48 - Enhancing text tables
9:36 - What's next and my takeaways
In this episode, we dive deep into the world of email campaign visualizations with Serena Purslow, a Data School Consultant at the Information Lab. Serena's visualization on email campaigns has not only received accolades from Tableau but has also garnered significant attention on Tableau Public. Join us as we uncover the inspiration, techniques, and tools behind this insightful dashboard.
🎨 What You'll Learn:
The power of mixing chart choices for a dynamic visual experience.
Leveraging Tableau's capabilities to enhance traditional data tables.
The art of creating mock data when real datasets are scarce.
#datavisualization #dataanalytics #marketinganalytics #tableau #crm
Повторяем попытку...
Доступные форматы для скачивания:
Скачать видео
-
Информация по загрузке: