Heikin Ashi Candlestick Charting
Автор: Homeschoolstocks
Загружено: 2025-07-19
Просмотров: 25
Описание:
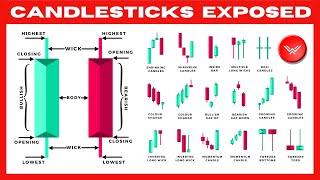
The Heikin-Ashi candlestick is a charting technique that smooths out price data to help traders better identify market trends and potential reversals. Unlike traditional candlesticks, which reflect exact open, high, low, and close prices for each period, Heikin-Ashi candles use averaged values that incorporate both current and previous data. This results in a cleaner, more visually consistent chart that filters out short-term noise.
Here’s how each candle is calculated:
Open: Average of the previous candle’s open and close.
Close: Average of the current period’s open, high, low, and close.
High: Highest value among the current high, open, and close.
Low: Lowest value among the current low, open, and close.
Why traders love it:
Green candles with no lower wicks often signal strong uptrends.
Red candles with no upper wicks suggest strong downtrends.
Small-bodied candles with shadows can indicate indecision or trend changes.
Because Heikin-Ashi doesn’t reflect real-time prices, it’s best used alongside other indicators like moving averages or RSI for confirmation.
Повторяем попытку...

Доступные форматы для скачивания:
Скачать видео
-
Информация по загрузке: