Pandas Part 6 | Time Series Data Analysis in Python | Dates, Trends & Resampling 🐼📊
Автор: PYAI HUB
Загружено: 2026-01-01
Просмотров: 65
Описание:
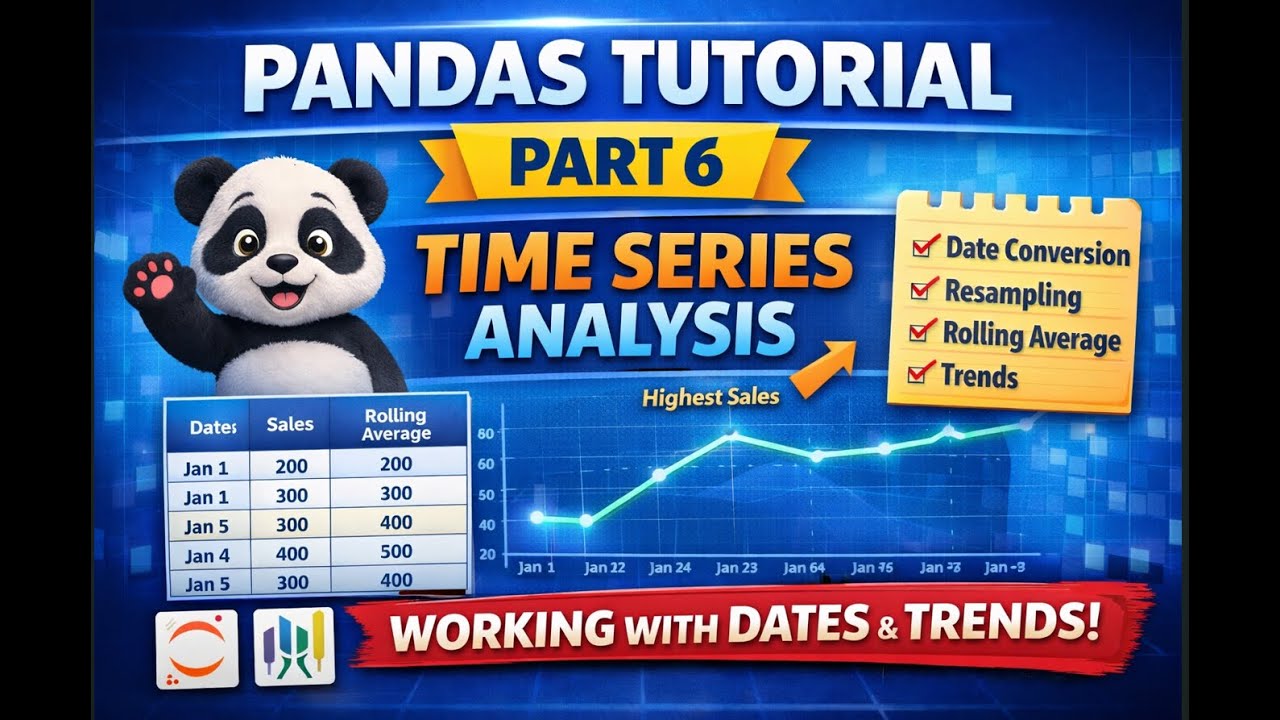
Welcome to Pandas Part 6 – Time Series Data Analysis 🚀
In this video, we explore how to work with date and time-based data using Pandas.
Time series data is everywhere — sales, logs, website traffic, finance, and analytics — and this lesson will help you understand it step by step.
📌 What you’ll learn in this video:
✔ Converting date columns to datetime
✔ Setting dates as index
✔ Accessing data using dates and ranges
✔ Calculating daily growth and percentage change
✔ Resampling data (daily, weekly, multi-day)
✔ Rolling averages for trend analysis
✔ Finding key insights from time-based data
✔ One simple visualization to understand trends
All examples are beginner-friendly, explained clearly, and work perfectly in Google Colab.
📂 GitHub Code:
https://github.com/athulyaesther777/P...
🎯 Previous Parts:
Pandas Basics → Selection → Cleaning → GroupBy → Merge & Join
👉 Next Video: Pandas Part 7 – Mini Practical Project
If you’re learning Python for Data Analysis or Data Science, this series is designed for you.
Keep practicing and keep learning! 🚀🐼
pandas part 6
time series pandas
pandas datetime
pandas resample
time series analysis python
python pandas tutorial
pandas rolling average
data analysis python
learn pandas
python data science
pandas google colab
#pandas
#python
#datascience
#dataanalysis
#timeseries
#pyai
#coding
Повторяем попытку...
Доступные форматы для скачивания:
Скачать видео
-
Информация по загрузке: