Standard Data - What if the trend visualization in Metabase isn't working for you?
Автор: Standard Co
Загружено: 2023-04-12
Просмотров: 2806
Описание:
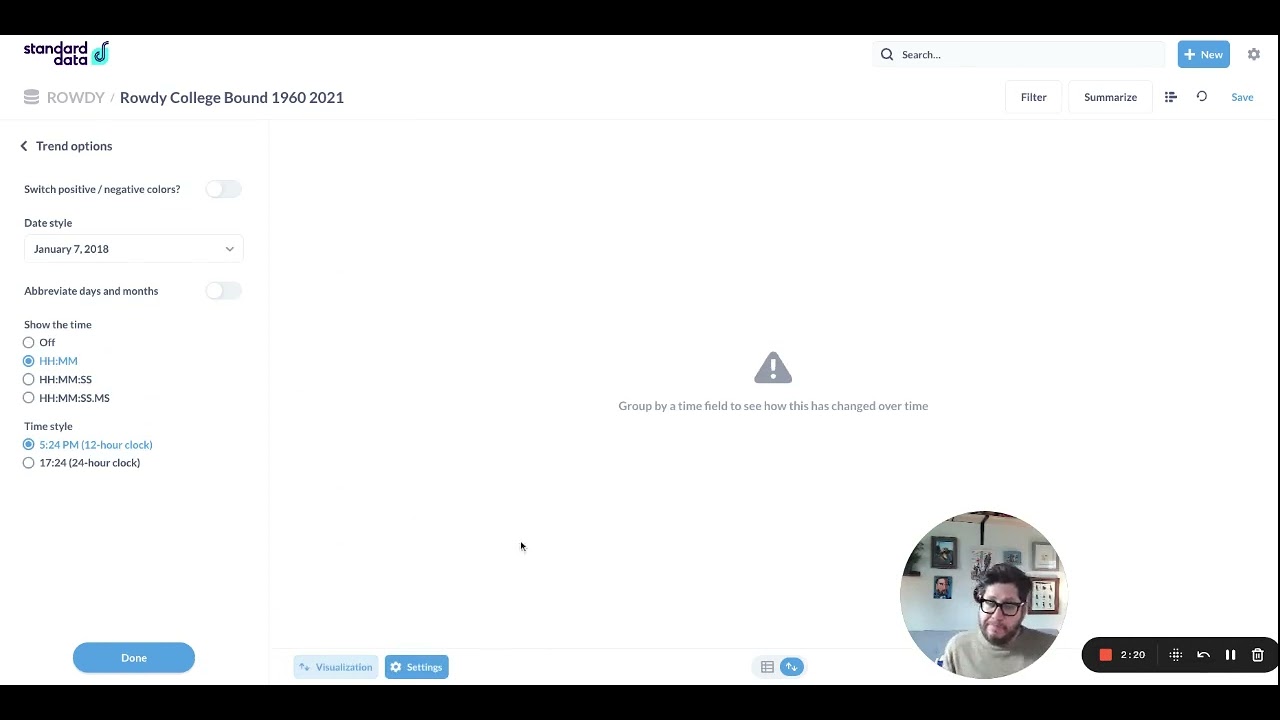
The trend visualization option is one of my favorite options in Metabase. But it's also one of the least predictable as to when it will, and will not, work. I recently was trying to get it to work but kept getting the error "Group by a time field to see how this changed over time". But I was dealing with a time field!
Turns out I wasn't! I switched to SQL query and cast the field to a date (see SQL below) and it magically worked!
*note: we stored just the year in our database as just a year. We switched it to a date/time field in Metabase
select DATE(CONCAT(year, '-01-01')) as 'date' ,
people
from [your_table]
group by DATE(CONCAT(year, '-01-01'))
order by year asc
__
Standard Co. Setting the Standard for a Better Data Experience.
We do two things very well:
Consultation: we work with organizations of all sizes worldwide to standardize and solve data problems big and small, enhancing organizations' Data Experience so they can make better decisions, faster.
Standard Data: our proprietary data toolkit used in 60+ countries.
__
Our powerful toolkit, Standard Data, helps organizations of all sizes Collect, Clean, and Visualize data — online and offline — solving real-world data management challenges in over 60 countries worldwide for some of the world’s most esteemed organizations. As a bootstrapped startup ourselves, we love working with other entrepreneurs to make sense of data so they can make better decisions and ultimately do what they do best — growth.
What is Standard Data? We're glad you asked...
Collect: create custom forms, automate reports, and collect data on the go -- any device, anytime, anywhere in the world (WiFi or not).
Clean: clean, standardize, and integrate data into useful formats & existing systems -- with powerful security features to boot.
Visualize: morph complex data into streamlined dashboards in minutes, not days -- visualize forecasts, trends, and results in real-time.
Setting the Standard for Data Management. Powerful tools. Real human support. Do more with data. Learn more at www.standardco.de.
Our powerful suite of Data Experience tools offer an end-to-end data solutions for organizations of all shapes, sizes, and scale -- from data collection to standardization to analysis, our team of real human experts has your back all along the way.
__
We help you do more with data so you can make better decisions faster. And we're happy to help at any stage of your Data journey.
Let's Talk.
www.standardco.de
Twitter: @standardcode
Instagram: @standardcode
LinkedIn: www.linkedin.com/company/standard-co
Schedule a Demo: [email protected]
Повторяем попытку...
Доступные форматы для скачивания:
Скачать видео
-
Информация по загрузке:


![Почему работает теория шести рукопожатий? [Veritasium]](https://image.4k-video.ru/id-video/ggI1xKzoANs)


