Explicit Measures , Measure Tables and Field Parameters in Power BI
Автор: London Business Analytics Group
Загружено: 2022-07-04
Просмотров: 1665
Описание:
A brief tutorial that explains explicit measures, how and why to create them, how to create a measures table for them and how to use field parameters.
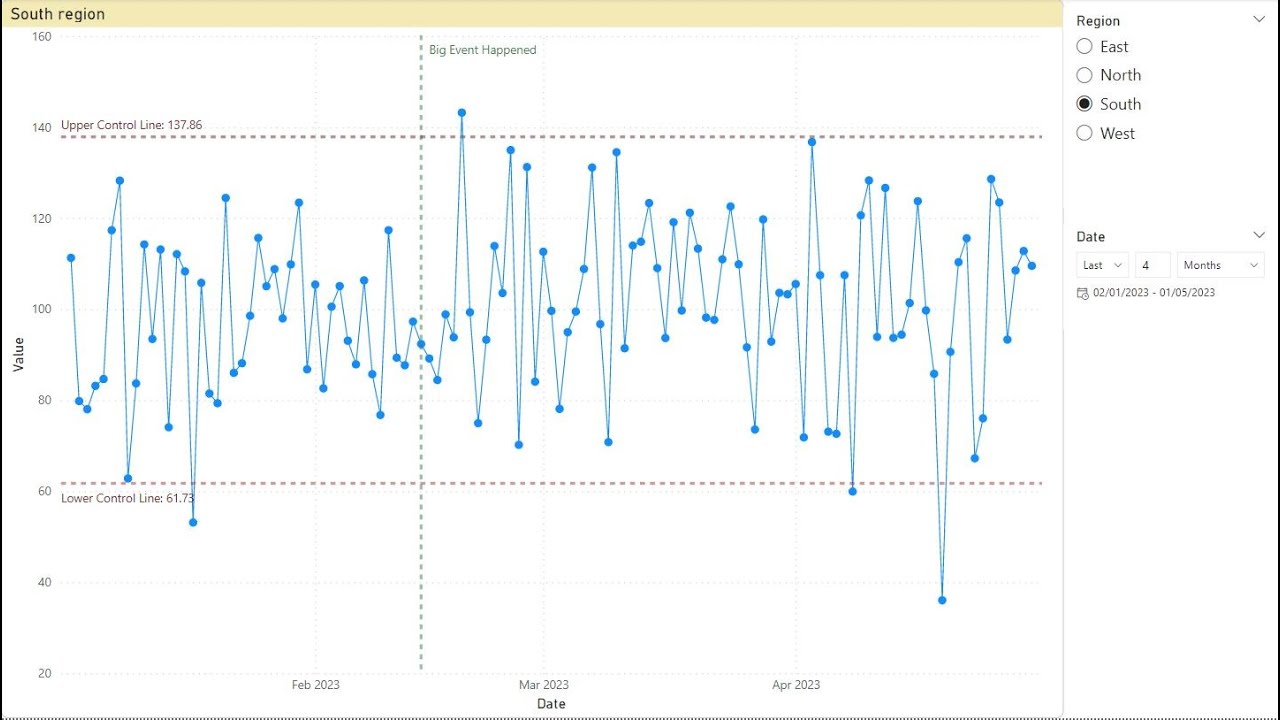
We improve the chart we built in the last video in three ways. The chart currently shows only the close price. We add a field parameter so that report viewers can choose which of these price types, open, high, low as well as close, to plot on the chart.
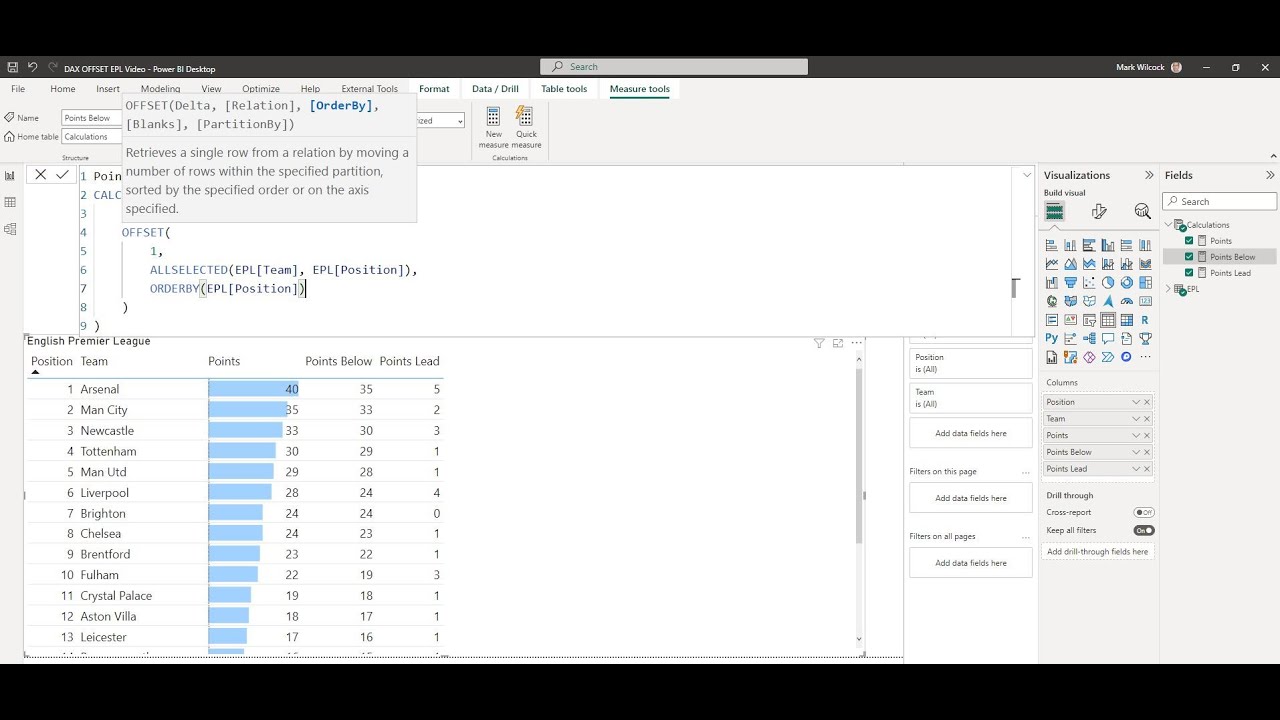
Before we do this we make two improvements to the data model. Firstly, we create explicit measures and replace the implicit measures in the chart with these. Secondly, we organise these explicit measures in a separate measures table.
Timestamps
00:00 Introduction
00:50 Quick review of the chart and data
01:20 Implicit measures
02:12 Create explicit measures and replace the implicit measures
04:00 Create a measures table to contain the explicit measures
05:40 Add a field parameter to choose price types and connect to the chart
07:25 Next challenges for this case study
We run a full range of data analysis and generative AI courses in London and online. See our courses at zomalex.co.uk
Повторяем попытку...

Доступные форматы для скачивания:
Скачать видео
-
Информация по загрузке: