Paris 2024 Olympics Dashboard Project in PowerBI with Python | The Developer
Автор: The Developer
Загружено: 2024-08-14
Просмотров: 54734
Описание:
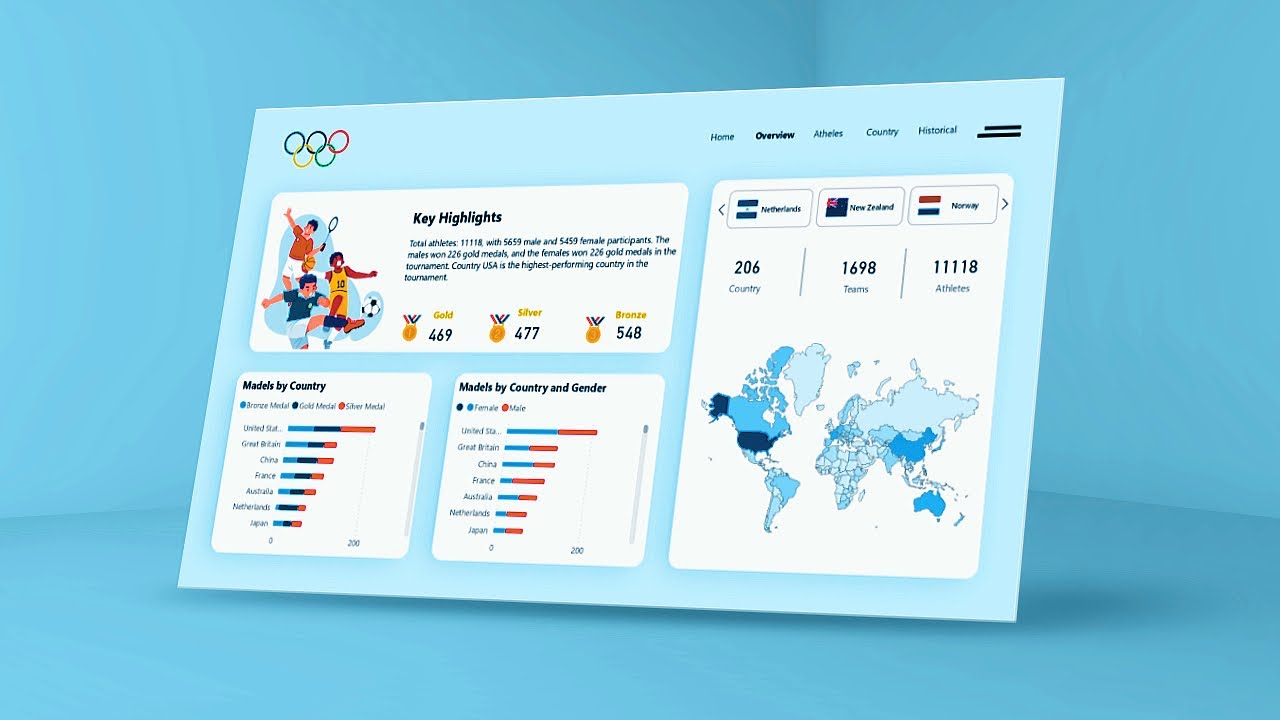
Get ready to dive into the world of data analytics with a special focus on the Paris 2024 Olympics! 🏅 In this tutorial, we'll guide you through the process of creating a dynamic and visually stunning Power BI dashboard that captures the excitement and data of the Olympic Games.
Download from here:
https://thedeveloperyt.com/product/ol...
📂Data Source Folder Link-
https://drive.google.com/drive/folder...
📚Blogs:
How to install Python:
https://thedeveloperyt.com/install-py...
How to Setup Kaggle with Python
https://thedeveloperyt.com/how-to-set...
How to Import Olympic Data using Python
https://thedeveloperyt.com/olympic-da...
📑Datatset Credit:
Name:Petro
Dataset Name: Paris 2024 Olympic Summer Games
Link:https://www.kaggle.com/datasets/piter...
Using a combination of Python, Kaggle datasets, Figma, and other powerful tools, you'll learn how to gather, process, and visualize Olympic data in a way that’s both informative and engaging. Whether you're a data enthusiast, a sports analyst, or a Power BI professional, this project will equip you with the skills to analyze large datasets and present insights that matter.
What You Will Learn:
Data Extraction with Python: Learn how to use Python to extract and clean data from Kaggle's comprehensive datasets on the Olympics. We'll walk you through the entire process, from accessing the data to preparing it for analysis in Power BI.
Designing the Dashboard in Figma: Discover how to design a professional and user-friendly dashboard interface using Figma. We'll cover layout planning, color schemes, and best practices for creating a visually appealing design that enhances the user experience.
Building the Dashboard in Power BI: With the data prepared and the design in place, you'll move on to building the dashboard in Power BI. Learn how to create interactive visualizations that track medal counts, athlete performance, event schedules, and more.
Advanced Power BI Features: Explore advanced Power BI functionalities, including DAX for complex calculations, Power Query for data transformation, and custom visuals to make your dashboard stand out.
Key Topics Covered:
Olympic Data Analysis: Understand how to analyze large datasets related to the Paris 2024 Olympics, including athlete statistics, country performance, and historical comparisons.
Python Data Processing: Use Python to automate data extraction, cleaning, and preparation for your Power BI dashboard.
Figma for Dashboard Design: Master the basics of Figma to create a sleek and modern dashboard design that enhances user interaction.
Interactive Visualizations: Create engaging visualizations in Power BI that allow users to explore Olympic data from different angles.
Real-Time Data Updates: Learn how to set up your dashboard to automatically update with new data, ensuring that it remains relevant throughout the Olympics.
Who Should Watch:
Data Analysts & BI Professionals: Take your Power BI skills to the next level by learning how to integrate Python and Figma into your projects.
Sports Analysts & Enthusiasts: Get insights into Olympic performance and trends with a customized dashboard tailored to your needs.
Students & Beginners: This tutorial is perfect for anyone looking to start their journey into data analytics with a fun and relevant project.
Developers: Learn how to combine multiple tools and technologies to create a comprehensive data analysis solution.
Why Watch This Video?
The Paris 2024 Olympics present a unique opportunity to work with real-world, large-scale data. By the end of this tutorial, you'll have the skills to create a Power BI dashboard that not only looks great but also provides valuable insights into one of the most watched events in the world. Whether you’re preparing for a career in data analytics or just looking to expand your skillset, this project is an excellent way to showcase your abilities.
Timestamps:
00:00:00 : Intro
00:06:18 : Python Script with Kaggle
00:18:10 : Power Query:Setup Tables
00:23:53 : Overview Page :DAX,Filters,Visualization
01:01:09 : Figma Background Creation
01:05:15 : Add Colors,Images,Icons
01:26:18 : Athelets Page
01:52:30 : Country Page
01:59:45 : Historical Page
Related Keywords:
Power BI dashboard
Paris 2024 Olympics
Python data analysis
Kaggle datasets
Figma design for dashboards
Sports analytics
Power BI and Python integration
Real-time data in Power BI
Advanced Power BI techniques
Olympic Games data analysis
🌍Social Media :-
Instagram : • / thedevelpoer.yt
Linkdin : • / the-developer-407024292
Telegram : • https://www.t.me/thedeveloperyt
#powerbi #olympics #parisolympics2024 #python #figma #olympic #powerbitutorialforbeginners #powerbitutorial #powerbidashboarddesign #powerbiproject #powerbitraining#powerbiandpowerquery
Повторяем попытку...
Доступные форматы для скачивания:
Скачать видео
-
Информация по загрузке:


![Tableau Dashboard Tips [Top 10 Tableau Dashboard Design Tips]](https://imager.clipsaver.ru/Lu0jrymqOGM/max.jpg)

