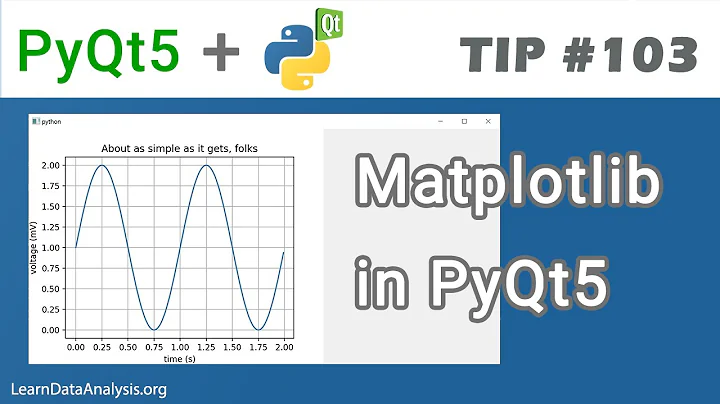
Как встроить Matplotlib Graph в приложение PyQt5
Автор: Jie Jenn
Загружено: 2020-07-19
Просмотров: 55968
Описание:
В этом руководстве по PyQt5 мы научимся встраивать график Matplotlib в приложение PyQt5.
Угостите меня кофе? Ваша поддержка очень ценна!
PayPal Me: https://www.paypal.me/jiejenn/5
Venmo: @Jie-Jenn
Исходный код: https://learndataanalysis.org/embed-m...
Больше обучающих видео на моём сайте → https://LearnDataAnalysis.org
Рассматриваю возможность поддержки моего канала через покупки на Amazon → https://amzn.to/2JkGeMD
Хотите повысить свою продуктивность? Ознакомьтесь с оборудованием (партнёрские ссылки Amazon), которое я использую в работе. Lenovo ThinkPad X1 Extreme 2-го поколения (4K) → https://amzn.to/2QT1CNk
Монитор ASUS Designo Curve MX38VC 37,5" → https://amzn.to/39rFSOQ
Logitech MX Master 3 Advanced (моя основная мышь) → https://amzn.to/2WSumK2
Logitech MX Anywhere 2S (в поездках) → https://amzn.to/2WTdKl5
Беспроводная клавиатура Logitech Craft Advanced → https://amzn.to/2QUjAz1
Концентратор VAVA USB C, адаптер USB C «8-в-1» → https://amzn.to/3dFim4g
Лампа для светотерапии Theralite Aura Bright → https://amzn.to/2UIp5lv
#Matplotlib #PyQt5
Повторяем попытку...
Доступные форматы для скачивания:
Скачать видео
-
Информация по загрузке: