Spectrum Lab - SID receiver spectrogram animation
Автор: Ched Cheddles
Загружено: 2015-09-08
Просмотров: 785
Описание:
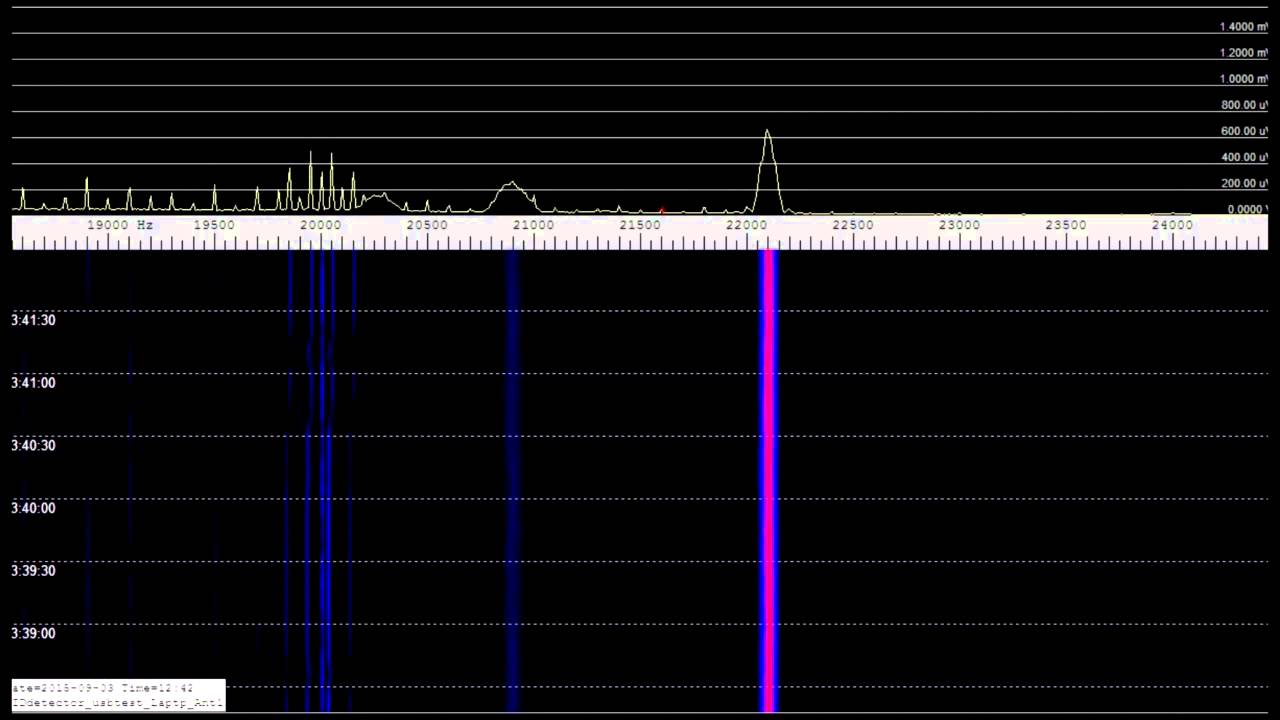
Taken from data recorded 3rd Sept 2015, this animation covers 7:00 AM to 4:00 PM showing what my DIY SID receiver was recording over the 9 hour period.
The horizontal ruler across the top 3rd of the screen shows the frequency's being recorded from around 18.5 kHz through 24.5 kHz
The peak at 19.58kHz is, I think, the Anthorn UK transmitter
The peak at 20.90kHz is, I think, the Saint-Assise transmitter in France
The peak at 22.10kHz is the Skelton UK transmitter
As I have only had this receiver up and running a few days I am trying to collect baseline data for comparison later on with genuine SID events.
Please visit my website at http://www.digitalrust.co.uk/ and have a look at my blog entries for photos and construction information regarding the receiver I built.
Повторяем попытку...
Доступные форматы для скачивания:
Скачать видео
-
Информация по загрузке: