Plate Velocities - Vignette 09
Автор: Christopher Scotese
Загружено: 2021-12-26
Просмотров: 23247
Описание:
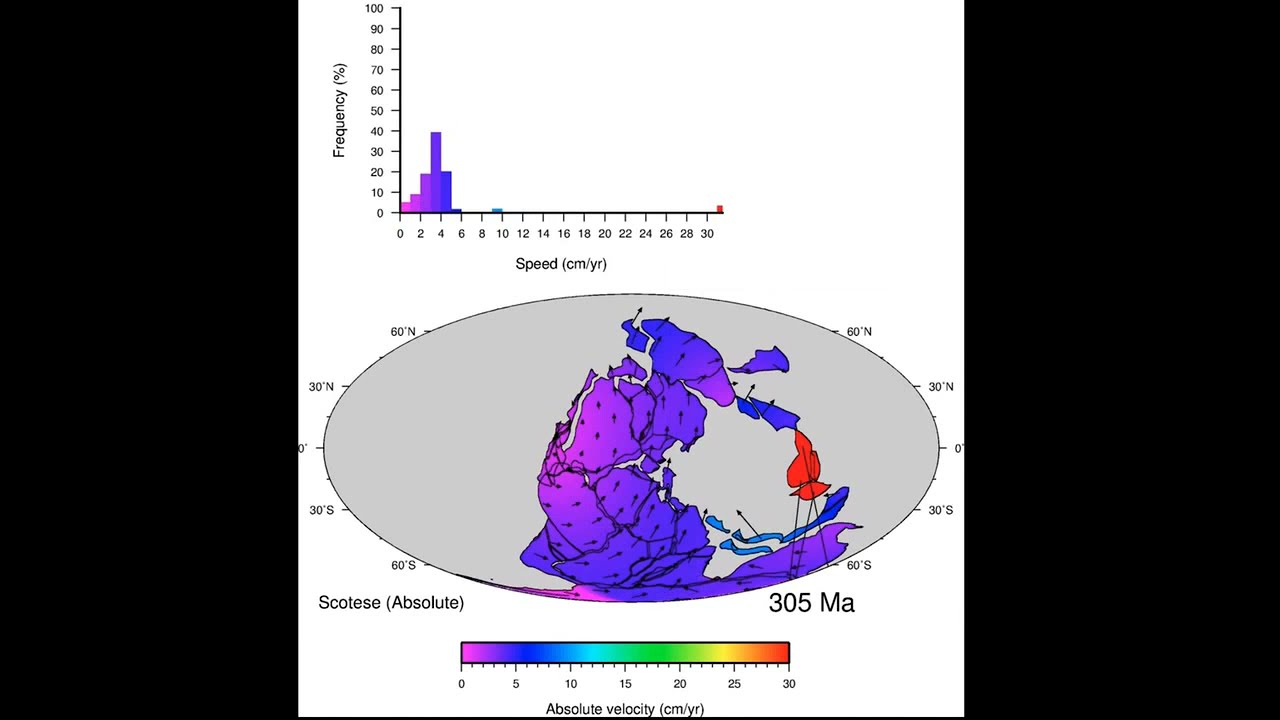
This animation was produced by my colleague, Sabin Zahirovic at the University of Sydney using my Global Plate Model. It shows how the direction and speed of the plates has changed through time. Slow moving plates are in purple (less than 4 cm/yr). Plates moving at average velocities (4-8 cm/yr) are show in blue. Fast moving plates are shown in light blue & green (greater than 10 cm.yr). Plates move slowly if there is a large continent attached (Eurasia, Gondwana, Pangea). Fast moving plates are attached to rapidly subducting ocean floor (e.g. Indian plate). Area of geographic interest: Global. Geological time interval: late Neoproterozoic (600 Ma) - Modern. (Note: short flashes fo bright colors are glitches in the plate model.)
keywords: plate tectonics, plate velocity, plate speed, direction of plate motion, plate acceleration, continental breakup, rifting, subduction, collision, Pangea, Laurentia, Baltica, Gondwana, Iapetus Ocean, Rheic Ocean, Tethys Ocean, Central Atlantic, South Atlantic, Africa, South America, sea floor spreading
Please cite as:
Scotese, C.R., & van der Pluijm, B., 2020. Deconstructing Tectonics: Ten Animated Explorations, "Plate Velocities", Earth and Space Science,
7, e2019EA000989. https://doi. org/10.1029/2019EA000989
More Information:
Linear magnetic anomalies on the ocean floor, which preserve the reversing polarity of the Earth’s magnetic field over time, and geochronologic data offer a robust geologic estimate of plate velocities during the last 200 million years. Velocities measured by a combination of paleomagnetic measurements, sea floor spreading, and subduction describe how plate have moved during the last 600 million years.. For these reasons, we use the history of plate motions from 600 Ma to today to explore tectonic plate velocities. Plate velocities are given in cm/year, which is equivalent to 10’s of km per million years (10 cm/yr = 111 km/my).
The PALEOMAP Global Plate Model demonstrates that some plates move fast and others slower, in the range of 1-18 cm/year, and that accelerations and decelerations are common. These changes in plate velocity occur because of fundamental changes in global plate geometry due to continetnal collisions and the subduction of mid-ocean ridges. Opening of the Atlantic was relatively slow, whereas opening of the Pacific was fast. The subduction of the Tethys Ocean was very fast at times, until collision between India and Asia which greatly slowed India’s northward movement.
Using the PALEOMAP model of plate motions, Zahirovic et al. (2015) tracked the velocities of about a dozen plates, which traveled at an average global plate velocity of ~4 cm/year. Notably, plates with large continental components tend to be relatively slow. Given that continental lithosphere is thicker and more buoyant than oceanic lithosphere, the continental component of a plate introduces drag on plate motion. Plates do not move at constant velocity over time and may move as fast as 18 cm/year, as exemplified by the Cenozoic northward motion of India. The plate velocities estimated from the global plate model match modern plate velocities that are based on geodetic measurements.
Повторяем попытку...
Доступные форматы для скачивания:
Скачать видео
-
Информация по загрузке:


