Richest Countries by GDP PPP Per Capita 1980-2030
Автор: World of Statistics
Загружено: 2026-02-28
Просмотров: 11
Описание:
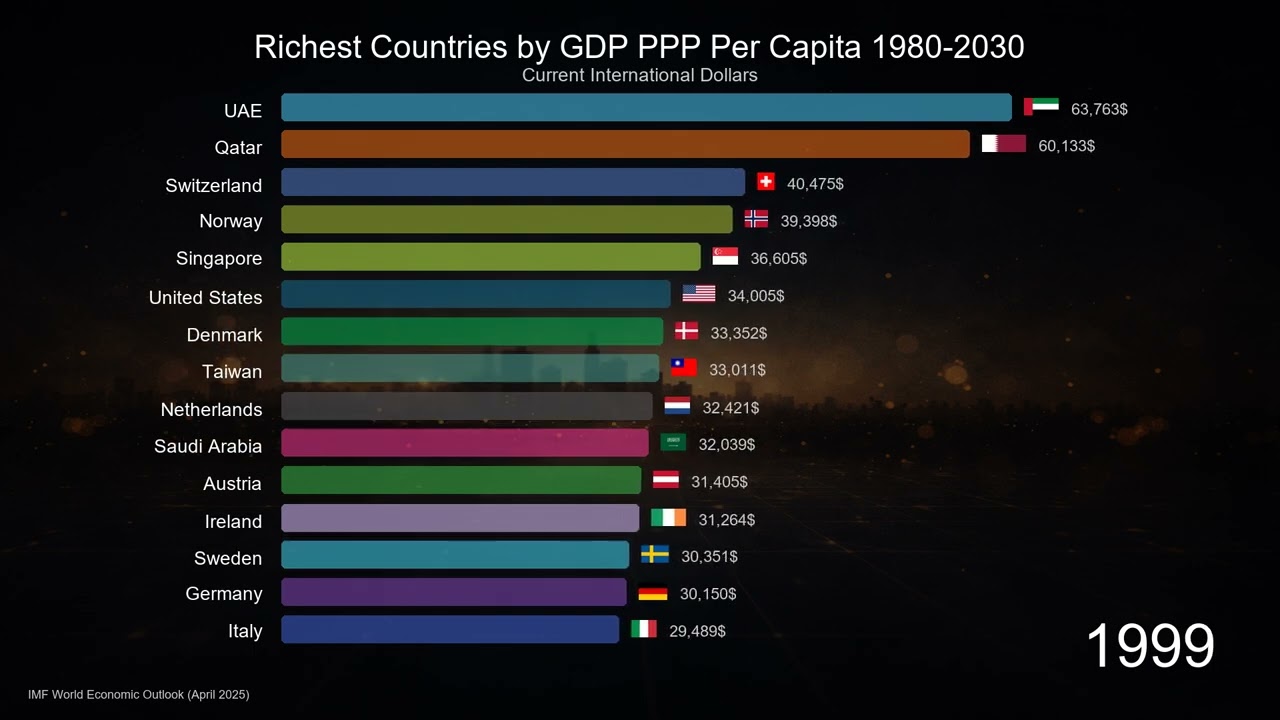
Bar chart race showing GDP PPP per capita by country from 1980 to 2030 — who are the richest countries in the world?
📊 WHAT THIS METRIC MEANS
GDP per capita at Purchasing Power Parity (PPP) measures the average economic output per person, adjusted for price differences between countries. Unlike nominal GDP per capita, PPP accounts for the fact that goods and services cost different amounts in different countries. A higher PPP per capita means residents can afford more goods and services — it's the closest single metric to comparing living standards across countries.
This is NOT the same as nominal GDP per capita (which uses market exchange rates) or GDP total (which doesn't account for population size).
📂 DATA SOURCES
• International Monetary Fund (IMF) — World Economic Outlook Database (April 2025)
• Covers 47 countries from 1980 to 2030
• 2025-2030 values are IMF staff projections based on current policies and trends
• Historical data harmonized from national accounts via IMF methodology
🔢 HOW IT'S CALCULATED
GDP PPP per capita = (Country's total GDP in local currency × PPP conversion factor) ÷ Population
The PPP conversion factor adjusts for price level differences — for example, $1 buys more in India than in Switzerland. The IMF calculates PPP factors using price surveys from the International Comparison Program (ICP). Values are expressed in "current international dollars" — a hypothetical currency that has the same purchasing power as the US dollar in the United States.
🌍 COUNTRY COVERAGE
47 countries selected for visual clarity and global representation:
• G7 economies (US, Japan, Germany, UK, France, Italy, Canada)
• High-income small economies (Singapore, Ireland, Qatar, Norway, Switzerland, Luxembourg, UAE, Hong Kong, Taiwan)
• Major European economies (Netherlands, Sweden, Denmark, Austria, Belgium, Finland, Spain, Portugal, Greece, Poland, Czech Republic, Romania, Hungary)
• Major Asian economies (China, India, South Korea, Indonesia, Malaysia, Thailand, Vietnam)
• Americas (Brazil, Mexico, Argentina, Chile, Venezuela)
• Other key economies (Australia, New Zealand, Israel, Turkey, Russia, Saudi Arabia, South Africa)
⚠️ NOTE
• Ireland's very high PPP per capita reflects multinational corporate profits booked in Ireland — actual Irish living standards are lower than the headline number suggests. Modified GNI (GNI*) is a better measure for Ireland.
• Russia data starts from 1992 (post-Soviet dissolution). Czech Republic from 1995.
• Qatar, UAE, and Saudi Arabia figures reflect oil wealth — per capita values are high due to relatively small populations and large hydrocarbon revenues.
• 2025-2030 values are IMF projections and may change based on future economic conditions, policy changes, or global events.
• China's dramatic rise from $275 (1980) to $29,191 (2025) represents one of the largest economic transformations in history.
#gdp #gdppercapita #ppp #economy #richestcountries #barchartrace #worldeconomy #economicgrowth #china #india #singapore #ireland #usa #dataviz #statistics
Повторяем попытку...
Доступные форматы для скачивания:
Скачать видео
-
Информация по загрузке: