Data Visualisation Using Tableau | Learn Data Sciences
Автор: Learn Data Sciences from Experts
Загружено: 2025-06-22
Просмотров: 2657
Описание:
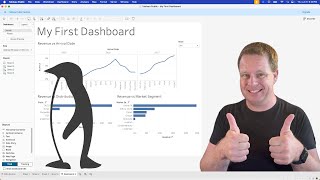
Data Visualization using Tableau
Hello friends, and welcome to this video on Data Visualization using Tableau!
In today’s data-driven world, we’re surrounded by numbers, metrics, and dashboards. But raw data alone doesn’t tell a story—it’s how we visualize that data that makes it powerful.
In this video, we’ll explore how to turn raw data into meaningful, compelling insights using Tableau—one of the most powerful and user-friendly data visualization tools out there.
Whether you’re a beginner just getting started, or someone looking to sharpen your Tableau skills, this session will walk you through:
Connecting to data sources
Building interactive dashboards and charts
Exploring Tableau’s interface
And most importantly—how to ask the right questions and let your data answer them.
So let’s dive in—and discover how to make your data speak clearly and visually with Tableau!
Повторяем попытку...

Доступные форматы для скачивания:
Скачать видео
-
Информация по загрузке: