strategy explainer
Автор: Marvin Appiah-Kubi
Загружено: 2026-05-30
Просмотров: 0
Описание:
USDCHF Long Strategy — Built From Scratch in Under 24 Hours | Full Quant Review vs S&P 500
I built this algorithmic trading strategy from scratch in less than 24 hours, on USDCHF — a market I had never worked with until that day. This video walks through the complete quantitative review: how it performs, whether it's overfit, and how it stacks up against the S&P 500 on a fair, risk-adjusted basis.
The strategy
A long-only USDCHF system on the H4 (4-hour) timeframe, backtested over 2015–2026 with 99% real-tick data. 54 trades, +$124,378 net profit (+62% on a $200k account), 4.4% CAGR, profit factor 1.83, 48% win rate with an average win roughly 2× the average loss.
Robustness testing
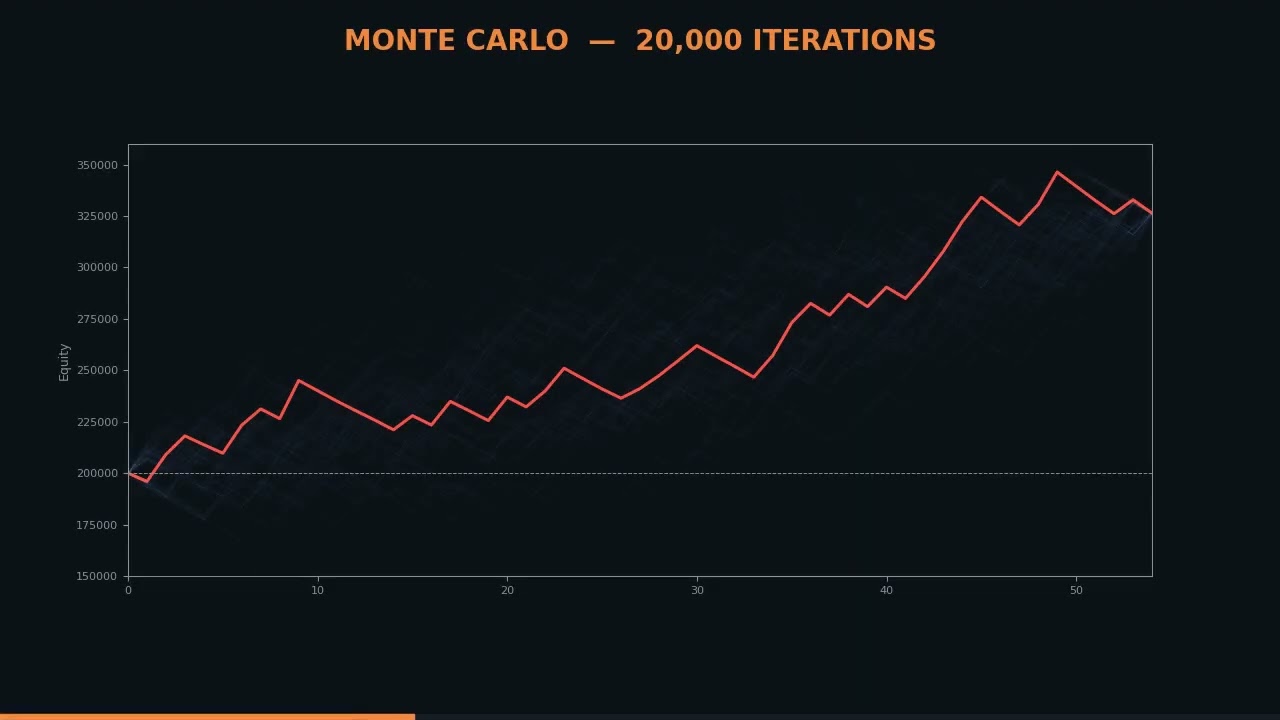
Monte Carlo, 20,000 iterations (trade-order permutation + bootstrap resampling): ~1.7% modeled probability of an overall loss — the edge holds up rather than depending on one lucky sequence.
Out-of-sample / forward testing across three windows: the 2015–2019 true holdout (data the model was never developed on), the 2020–2026 development period, and the most recent 2025–2026 forward year. Profit factor stayed above 1.0 in all three — evidence it is not overfit.
Realized max drawdown 9.8%, with a more conservative Monte Carlo 95th-percentile drawdown of 18.8%.
The S&P 500 comparison (the honest version)
On raw return the S&P 500 wins — about 14.6% CAGR vs the strategy's 4.4% over the same period. But that ignores risk: the strategy uses roughly a third of the index's drawdown (the S&P drew down ~25% in 2022 and ~34% in the 2020 COVID crash). Normalizing for risk using the Calmar ratio (return per unit of drawdown), the two come out roughly tied — and the strategy actually made money in 2020 and 2022 while equities fell, giving it real crisis-alpha and low correlation to stocks.
Final verdict: risk-adjusted parity with the S&P 500 — a tie, not a loss — with genuine diversification value. Tier 1, Grade A−. Best used as a low-correlation / crisis-alpha sleeve alongside an equity position rather than as a standalone replacement for it. Main caveats: a thin sample of 54 trades, and the need to size to the Monte Carlo drawdown rather than the flattering backtest figure.
Chapters:
0:00 Intro
0:03 Built from scratch in under 24 hours
0:07 Core performance
0:12 Monte Carlo (20,000 runs)
0:17 Forward / out-of-sample test
0:22 Raw return vs S&P 500
0:26 Risk-normalized comparison
0:31 Performance at equal risk
0:36 Final verdict & tier
This is a backtested research project shared for educational purposes only. It is not financial advice, and past performance does not guarantee future results.
A couple of notes: I kept the chapter timestamps aligned to the 43-second video, so adjust them if you re-render at a different length. I also added the not-financial-advice line at the end — worth keeping given the performance claims. Want me to write a shorter version for the pinned comment or a punchier one-line title alternative?You said: give a project description
Повторяем попытку...
Доступные форматы для скачивания:
Скачать видео
-
Информация по загрузке: