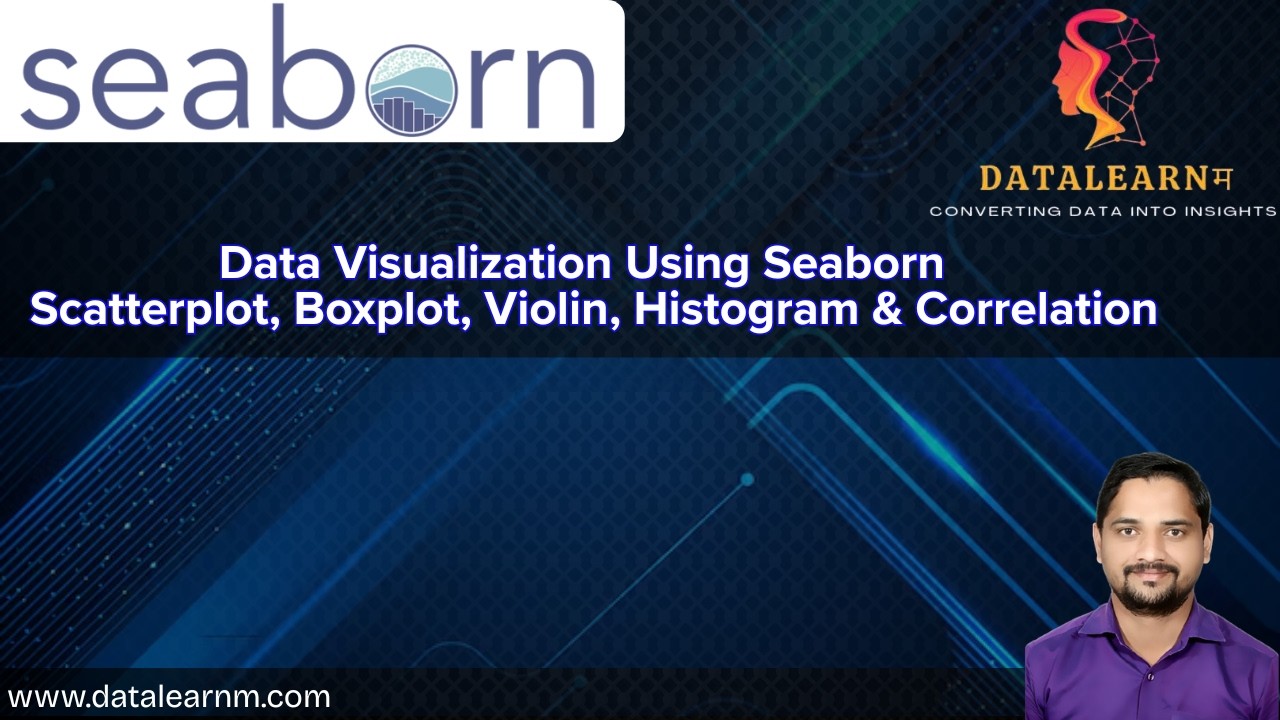
Day 09 | Data Visualization Using Seaborn | Scatterplot, Boxplot, Violin, Histogram & Correlation
Автор: DataLearnm
Загружено: 2026-02-15
Просмотров: 65
Описание:
In this complete tutorial on Data Visualization using Seaborn in Python, you will learn how to create beautiful and informative statistical graphics step by step.
Seaborn is a powerful Python data visualization library built on top of Matplotlib. It helps in creating attractive and meaningful statistical plots with minimal code.
🔹 Topics Covered in this Video:
✅ Introduction to Seaborn
✅ Line Plot (lineplot)
✅ Scatter Plot (scatterplot)
✅ Box Plot (boxplot)
✅ Violin Plot (violinplot)
✅ Count Plot (countplot)
✅ Histogram (histplot)
✅ Correlation & Heatmap
✅ Real-time examples with Python code
This video is perfect for:
✔️ Data Science Beginners
✔️ Python Learners
✔️ Machine Learning Students
✔️ BCA / BSc IT / MCA Students
✔️ Anyone preparing for interviews or exams
By the end of this tutorial, you will confidently create professional data visualizations using Seaborn.
📌 Tools Used:
Python
Pandas
Matplotlib
Seaborn
If you found this video helpful, don’t forget to Like, Share, and Subscribe to DataLearnm for more Python, Data Science, and Machine Learning tutorials.
Повторяем попытку...
Доступные форматы для скачивания:
Скачать видео
-
Информация по загрузке:

![Best of Deep House [2026] | Melodic House & Progressive Flow](https://imager.clipsaver.ru/Il-ZpBuC8tA/max.jpg)