Скачать
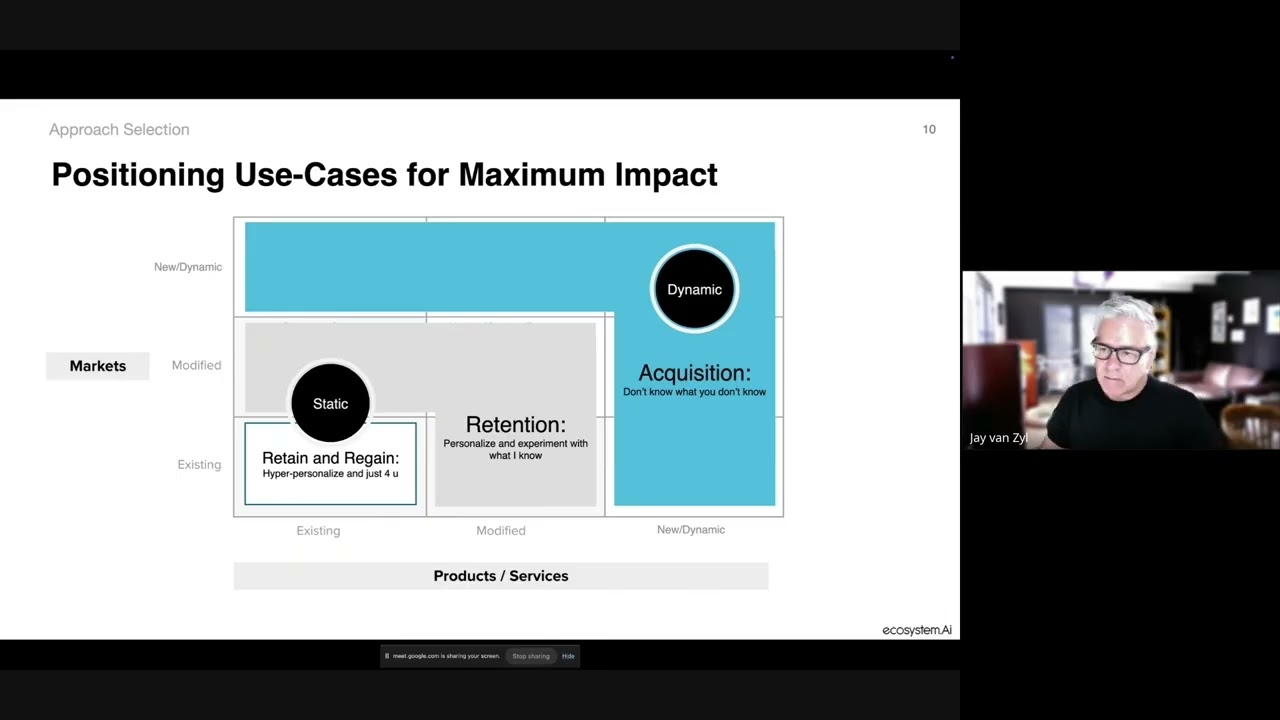
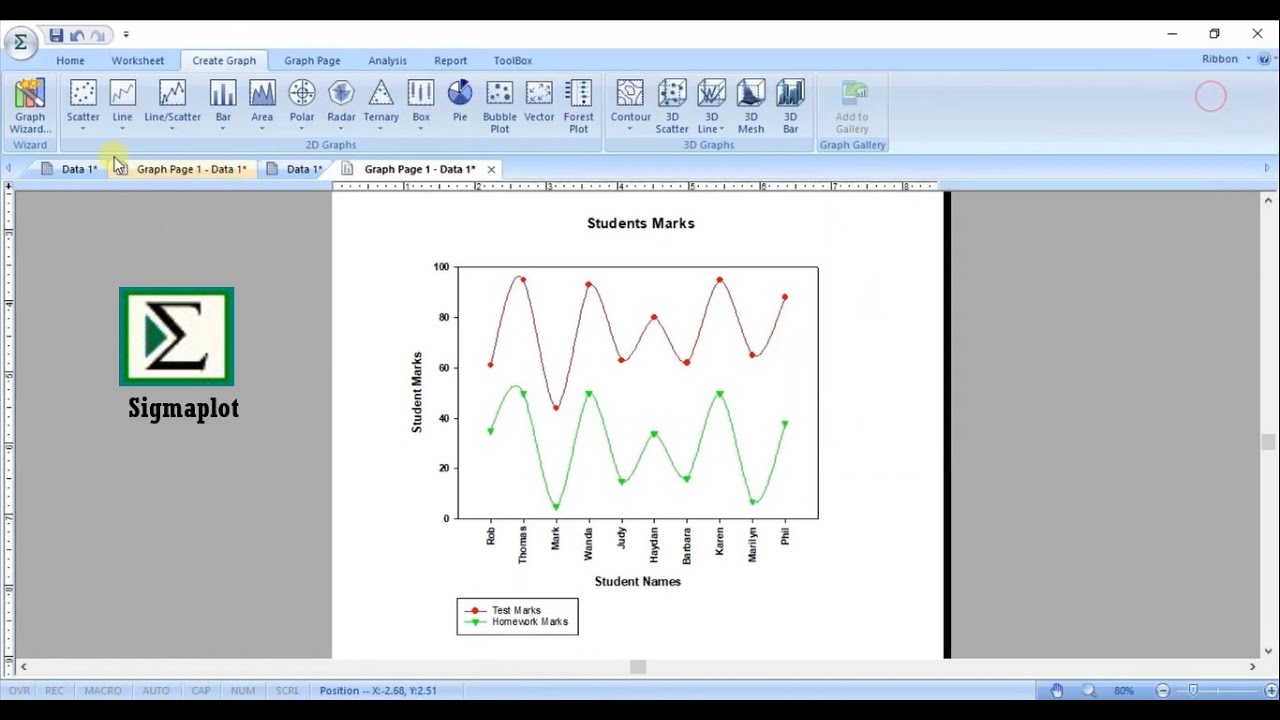
Data visualization and statistics with SigmaPlot
Автор: Alfasoft.com
Загружено: 2021-11-17
Просмотров: 1652
Описание:
SigmaPlot is recognized as one of the easiest tools to use for data vizualization and data analysis. Learn how to create scientific graphs and statistical reports with SigmaPlot in this webinar.
• Introductions
• Company background and product history
• SigmaPlot v14.5 Demo
• SigmaPlot NG Intro and demo
• SigmaPlot future vision
More information:
https://www.alfasoft.link/sigmaplot
Не удается загрузить Youtube-плеер. Проверьте блокировку Youtube в вашей сети.
Повторяем попытку...
Повторяем попытку...

Доступные форматы для скачивания:
Скачать видео
-
Информация по загрузке: