[Bite-Size Guide] Graphing Linear Equation “2𝑥 – 3𝑦 = 6” by Plotting Points | Step-by-Step Algebra
Автор: Math Doodle - Algebra
Загружено: 2023-12-06
Просмотров: 895
Описание:
This video will guide you through [How to Graph Linear Equation “2𝑥 – 3𝑦 = 6” by Plotting Points].
〰️
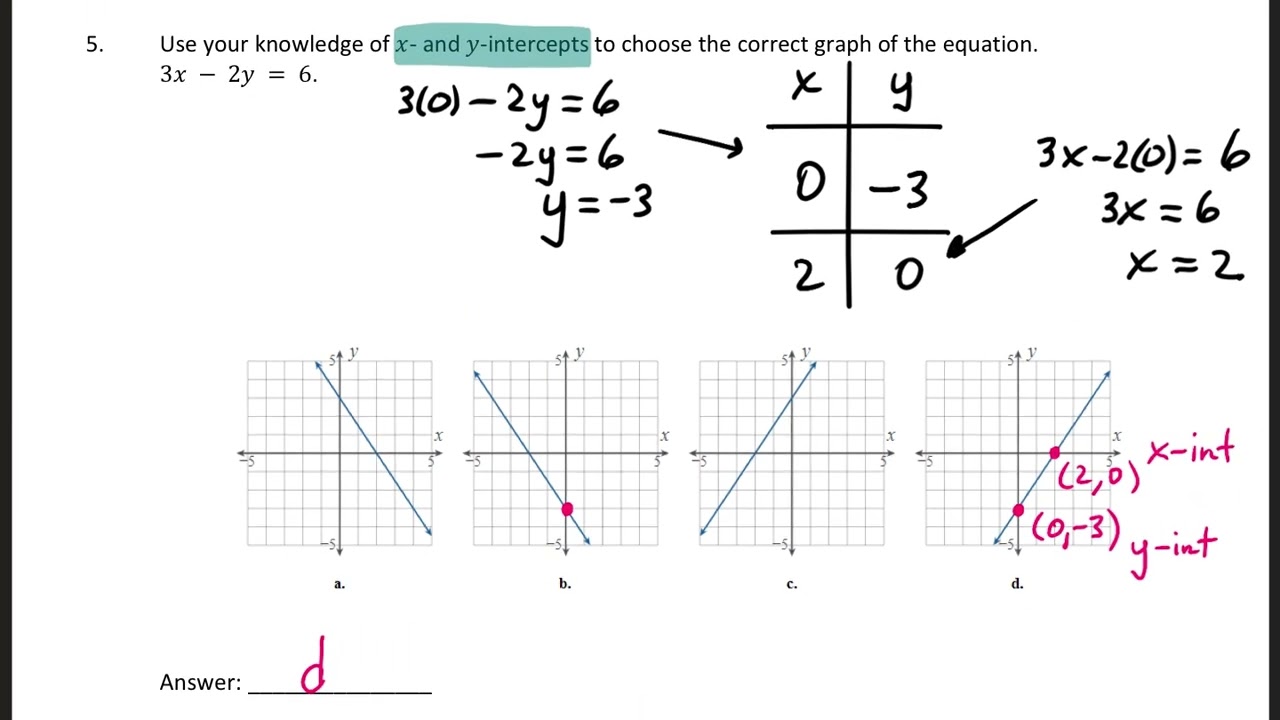
📌 How to Graph a Linear Equation by Plotting Points
✓ Step 1. Solve the equation for 𝑦.
✓ Step 2. Find three points whose coordinates are solutions to the equation.
Organize them in a table.
✓ Step 3. Plot the points in a rectangular coordinate system.
Check that the points line up.
If the points do not line up, carefully check your work.
✓ Step 4. Draw a line through the three points.
Extend the line to fill the grid.
Put arrows on both ends of the line.
〰️
✅ More BITE-SIZE VIDEOS on "Graphing Linear Equations by Plotting Points”
➤ Graph “𝑦 = 2𝑥 + 1”: • [Bite-Size Guide] Graphing Linear Equation...
➤ Graph “𝑦 = –3𝑥”: • [Bite-Size Guide] Graphing Linear Equation...
➤ Graph “𝑦 = (1/2)𝑥 + 1”: • [Bite-Size Guide] Graphing Linear Equation...
➤ Graph “3𝑥 + 𝑦 = –1”: • [Bite-Size Guide] Graphing Linear Equation...
🗂 Playlist: “Graphs” ➜ • Плейлист
🗂 Playlist: “Rectangular Coordinate System” ➜ • Rectangular Coordinate System
🗂 Playlist: “Graphing Linear Equations” ➜ • Graphing Linear Equations
🗂 Playlist: “Slope and 𝑦-Intercept of Line” ➜ • Slope and Intercepts of Line
🗂 Playlist: “Parallel/Perpendicular Lines” ➜ • Parallel/Perpendicular Lines
〰️
✏️ Need FREE MATH HELP? Check out our website on Graphs ➜ https://math-doodle.com/math-doodle-h...
〰️
▶️ Click Here to Subscribe to our Channel ➜ / @mathdoodle
〰️
📖 About Math Doodle: This channel is our effort to support students, teachers, and parents by sharing our tutorial and problem-walkthrough contents that cover a wide range of algebra topics!
🌐 Website: https://math-doodle.com/
📧 E-mail: [email protected]
Hopefully, you have found the math help you were looking for! 🙏 Thank you for checking out our videos! 💯
〰️
🌏 Translated titles:
Spanish: Graficar ecuaciones lineales trazando puntos
French: Représenter graphiquement des équations linéaires en traçant des points
German: Grafische Darstellung linearer Gleichungen durch Einzeichnen von Punkten
Portuguese: Representando graficamente equações lineares traçando pontos
Hindi: बिंदुओं को आलेखित करके रैखिक समीकरणों का रेखांकन करना
Filipino: Pag-graph ng mga Linear Equation sa pamamagitan ng paglalagay ng mga puntos
Indonesian: Membuat Grafik Persamaan Linier dengan memplot titik-titik
Japanese: 点をプロットして一次方程式をグラフ化する
Russian: Построение графика линейных уравнений путем нанесения точек
Vietnamese: Vẽ đồ thị phương trình tuyến tính bằng cách vẽ các điểm
Повторяем попытку...
![[Bite-Size Guide] Graphing Linear Equation “2𝑥 – 3𝑦 = 6” by Plotting Points | Step-by-Step Algebra](https://imager.clipsaver.ru/ngQ91dnTGtw/max.jpg)
Доступные форматы для скачивания:
Скачать видео
-
Информация по загрузке:
![[Bite-Size Guide] Graphing Linear Equation “𝑥 = 2” (Vertical Line) | Step-by-Step Algebra](https://imager.clipsaver.ru/a3mEt5rlpTI/max.jpg)